
U.S. equity indices, particularly the S&P 500 and Nasdaq 100, are showing strong bullish momentum, continuing to hit record highs.
For example, the S&P 500 has risen approximately 33% from its April 7 low of 4,835 points to a new peak of 6,427 points as of yesterday, confirming its entry into a bull market.
Similarly, the Nasdaq 100 has climbed about 43%, rising from a low of 16,542 points on April 7 to yesterday’s high of 23,589 points, clearly entering a strong bullish phase.
Meanwhile, the VIX (Volatility Index) is stabilizing around 16 points, reflecting investor confidence in U.S. stocks.
Markets are anticipating continued bullish momentum in U.S. equities in the coming period—despite high valuations—driven by several key factors, most notably:
- Over 80% of U.S. companies have reported earnings that beat analysts’ expectations, especially the major tech giants like Alphabet, Meta, Microsoft, Apple and Amazon , all of which posted better-than-expected revenues and profits—except for Tesla.
Notably, shares of Meta and Microsoft, along with Nvidia—now the world’s largest company by market cap—continued to post record highs in yesterday’s session. Microsoft also reached a 4 trillion-dollar market cap, making it the second-largest company globally. - Easing trade tensions, particularly after the U.S. reached new trade agreements with Japan, the European Union, and South Korea, has boosted risk assets including the S&P 500 and Nasdaq 100.
Investors are cautiously watching developments related to tariffs with other countries, especially with new tariffs set to go into effect today, August 1, 2025.
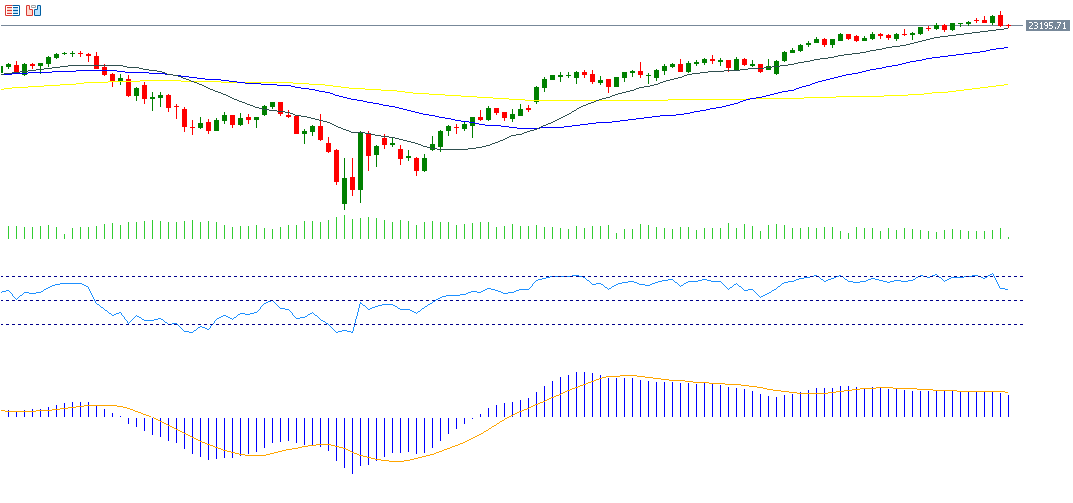
Technical outlook for Nasdaq 100 remains bullish
- The 20-day, 50-day, and 200-day moving averages are aligned in a bullish formation, with the 20-day MA above the 50-day, and the 50-day above the 200-day, signaling strong technical momentum.
- The Relative Strength Index (RSI) is currently at 65, indicating strong upward momentum.
- The Positive Directional Indicator (+DMI) is at 33, while the Negative DMI (-DMI) is at 14, showing a wide gap and strong buying pressure.
- Most importantly, the Average Directional Index (ADX) stands at 30, confirming that the bullish trend is both strong and sustained.
Please note that this analysis is provided for informational purposes only and should not be considered as investment advice. All trading involves risk.

