
The UK’s headline Consumer Price Index (CPI) fell to 1.7% year-on-year as of yesterday, which is lower than the forecasted 1.9% and the previous reading of 2.2%. It is also below the Bank of England’s target rate of 2% for the first time in 3.5 years, supporting the Bank of England’s case for further interest rate cuts in the coming phase. Similarly, the core CPI, which excludes food and energy, declined to 3.2% year-on-year, lower than the forecasted 3.4% and the previous 3.6%.
The GBP/USD continues its downward trend, hitting 1.2976 yesterday, its lowest level since August 20, 2024, and currently trades around 1.3000. The pair has dropped about 3% from its September 26, 2024, peak of 1.3434, to yesterday’s low of 1.2976. However, it remains up by approximately 2% year-to-date.
A key factor weighing on the GBP/USD is the strength of the U.S. dollar, which is driven by better-than-expected labor market and inflation data, along with cautious comments from most Federal Reserve members about the future path of interest rates.
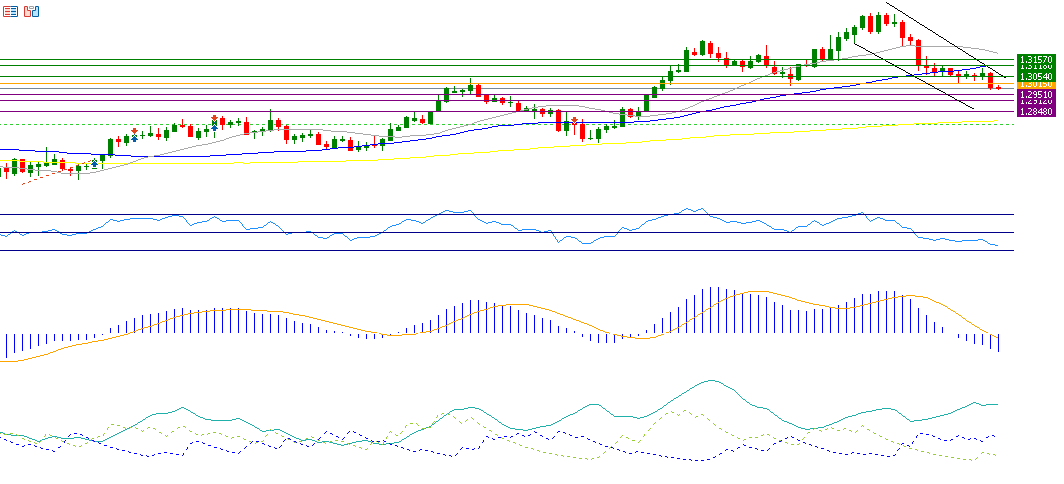
On the technical side, if the GBP/USD breaks below its pivot point at 1.3015, it may target support levels at 1.2951, 1.2912, and 1.2848. Conversely, a break above the pivot point could see the pair targeting resistance levels at 1.3054, 1.3118, and 1.3157.
As for the Relative Strength Index (RSI), it currently stands at 36, indicating bearish momentum for the GBP/USD. The Moving Average Convergence Divergence (MACD) line, shown in blue, is below the orange Signal Line, also signaling negative momentum.
The Directional Movement Index (DMI+) is around 11 points, while the DMI- is at 25 points, indicating a relatively large gap between the two, suggesting strong selling pressure on the GBP/USD. Furthermore, the Average Directional Index (ADX) is at 33 points, reflecting the strength of this bearish trend.
Please note that this analysis is provided for informational purposes only and should not be considered as investment advice. All trading involves risk.


