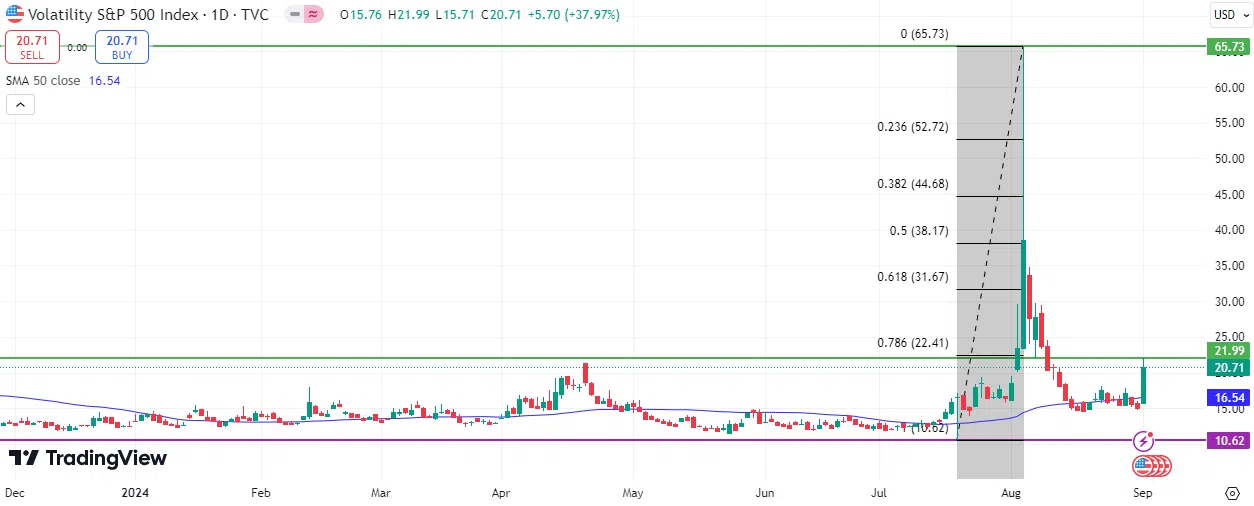
The VIX, often referred to as the “fear and volatility index,” which reflects investors’ expectations regarding price movements in the stock market, rose to 21.99 points yesterday, its highest level since August 9, 2024. This increase indicates that investors are unsettled and uneasy in U.S. stock markets. The VIX has risen by about 66% since the beginning of this year, reaching the level of 21.99 points yesterday.
This notable increase is attributed to several factors, the most prominent of which are:
- The rise in the U.S. Dollar Index, which measures the performance of the dollar against a basket of six major currencies, reaching approximately 102.0 points yesterday, putting pressure on the S&P 500 Index.
- The decline in some U.S. economic data, such as the Institute for Supply Management (ISM) Manufacturing Purchasing Managers’ Index (PMI), which showed a contraction at 47.2 points, below expectations (47.5). The Manufacturing PMI also fell to 47.9 points, below expectations (48.0) and the previous reading (49.6), marking its lowest level since August 2023.
Markets are currently betting on U.S. interest rate cuts, with a 58% probability of a 25 basis point cut and a 42% probability of a 50 basis point cut at the September 2024 meeting.
On Friday, September 6, important indicators will be released in the United States, including the non-farm payrolls report, along with the unemployment rate and average hourly earnings indicators. Expectations suggest that the U.S. economy will add 164,000 new jobs in August, after adding 114,000 jobs in July. As for the unemployment rate, expectations indicate it will decrease to 4.2% in August, down from 4.3% in July. Finally, analysts expect average hourly earnings to grow by 0.3% on a monthly basis, higher than the July reading of 0.2%.
From a technical perspective, and according to Fibonacci analysis, the VIX is likely to rise to levels of 22.41 (78.60%), 31.67 (61.80%), and 38.17 (50%).
Please note that this analysis is provided for informational purposes only and should not be considered as investment advice. All trading involves risk.


