
The exchange rate of the US dollar against the Canadian dollar continues its upward trend, reaching 1.4019 today, the highest level since May 22, 2020. The USD/CAD pair has increased by about 4% since the low of September 25, 2024, when it stood at 1.3419, reaching yesterday’s peak of 1.4019. It has risen by approximately 6% since the beginning of the year to date.
Recent Canadian economic data indicates that the Canadian economy is facing weakness, as:
- The employment change in October showed an increase of only 14,500 jobs, lower than the expected 27,900 and the previous reading of 46,700.
- The Ivey Purchasing Managers Index (PMI) for October dropped to 52.0 points, indicating contraction, and was below both the forecasted 54.2 and the previous reading of 53.1.
- Retail sales grew by just 0.4%, lower than the expected 0.5% and the previous reading of 0.9%.
- The annual Consumer Price Index (CPI) dropped to 1.6%, below the expected 1.8% and the previous reading of 2.0%, marking a rate lower than the Bank of Canada’s 2% target.
On October 23, 2024, the Bank of Canada cut interest rates by 50 basis points to 3.75%, in line with market expectations. This was the fourth consecutive rate cut this year, following three previous reductions of 25 basis points each.
It is worth noting that several factors have provided upward momentum for the US dollar against the Canadian dollar, including the strength and resilience of the US economy, as well as the dollar’s status as a safe haven amid the current geopolitical tensions in the Middle East. Additionally, the possibility of Donald Trump’s return to the presidency, particularly his pledge to cut corporate tax rates and impose tariffs on foreign imports, could fuel US inflation.
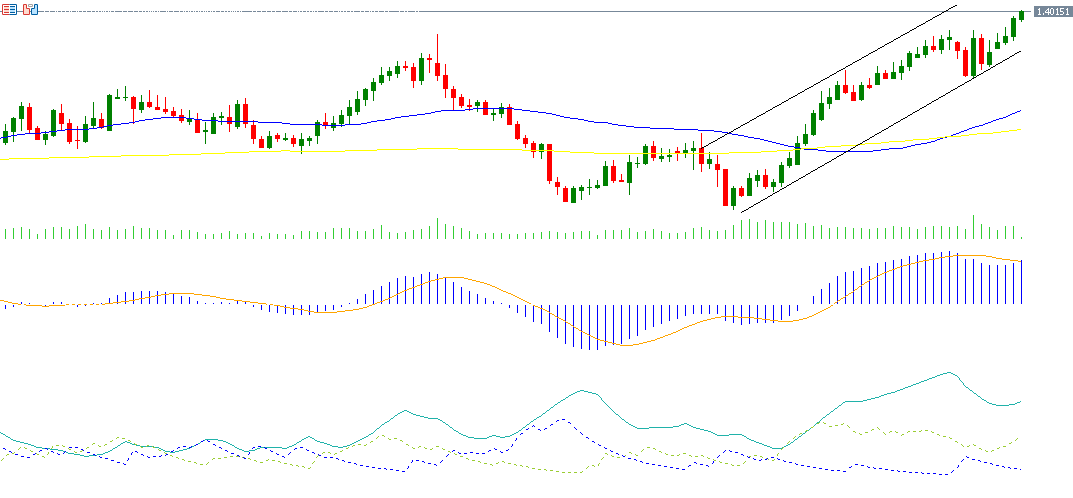
Regarding the technical side, if the pivot point of 1.3976 for the USD/CAD pair is broken, the price may target support levels at 1.3950, 1.3904, and 1.3878. However, if the pivot point is surpassed, the price may target resistance levels at 1.4022, 1.4048, and 1.4094.
The Relative Strength Index (RSI), currently at 67, indicates positive momentum for the USD/CAD pair. The Positive Directional Indicator (DMI+) stands at around 26, while the Negative Directional Indicator (DMI-) is at approximately 8. The significant gap between these two indicators suggests strong buying pressure on the US dollar against the Canadian dollar. More importantly, the Average Directional Index (ADX) is at around 48, signaling that the upward momentum of this trend is strong.
Please note that this analysis is provided for informational purposes only and should not be considered as investment advice. All trading involves risk.


