
U.S. stock markets are experiencing sharp fluctuations, with the VIX index rising to levels above 23 points yesterday, its highest level since September 6.
U.S. stock indices closed lower for the second consecutive day, including the S&P 500 (-1.86%), Nasdaq 100 (-2.44%), Russell 2000 (-1.70%), and Dow (-0.90%). However, these indices remain up since the beginning of the year: S&P 500 (20%), Nasdaq 100 (19%), Russell 2000 (8%), and Dow (11%).
The financial results for six major technology companies (Tesla, Alphabet, Microsoft, Meta, Amazon, and Apple) from the “Magnificent 7” were generally strong and exceeded expectations in terms of revenue and profits. However, the future outlook for some companies, like Microsoft, was negative. Despite its operating profits surpassing $30 billion for the first time in the company’s history, it announced slower growth forecasts.
The valuations for these large-cap companies are high, so we may witness profit-taking or corrections in the upcoming phase, which is a healthy process. However, the momentum remains positive due to their investments in artificial intelligence.
Additionally, the results from both Visa and Mastercard came in better than expected, indicating strong consumer spending.
Markets are closely awaiting the release of non-farm payroll indicators, unemployment rates, average hourly wages, and both the manufacturing and services PMIs from ISM in the United States.
Forecasts indicate that the U.S. economy is expected to add 108,000 new jobs in October after adding 254,000 jobs in September. As for the unemployment rate, it is expected to remain steady at 4.1%, matching September’s reading. Finally, analysts expect the year-on-year average hourly wage to record 4.0%, consistent with September’s reading.
The markets are also anticipating Nvidia’s financial results on November 20, which will also directly impact stock market movements.
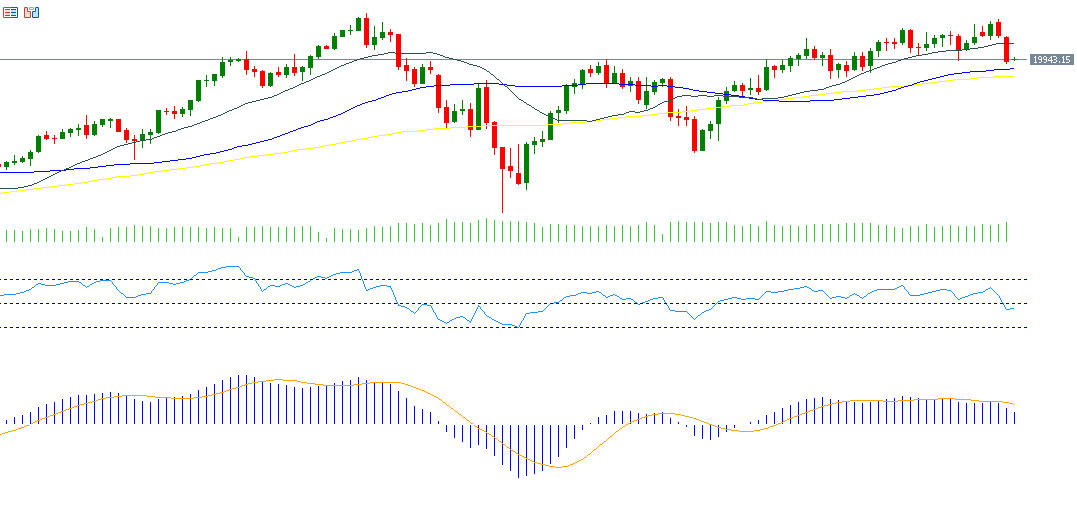
From a technical perspective, the Nasdaq 100 index is trading between the 20-day moving average (in gray) at 20,230 and the 50-day moving average (in blue) at 19,784. The 50-day moving average remains a strategic support level, and any downward breach of this support could lead to a continuation of the bearish trend for the Nasdaq 100 index.
The Relative Strength Index (RSI) currently registers at 45 points, indicating bearish momentum for the Nasdaq 100. Meanwhile, the MACD indicator shows a downward crossover between the MACD line (in blue) and the signal line (in orange), giving a negative momentum signal for the Nasdaq 100.
Please note that this analysis is provided for informational purposes only and should not be considered as investment advice. All trading involves risk.

