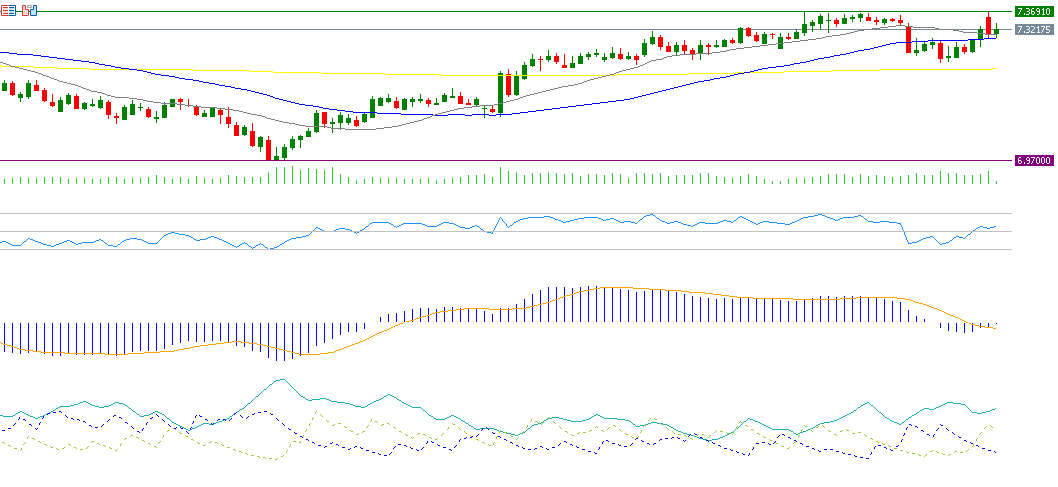
The U.S. dollar to Chinese yuan (USD/CNY) exchange rate reached 7.3662 yesterday, marking its highest level since December 31, 2024. The pair is currently trading near 7.3300 and has risen approximately 6% since its low on September 27, 2024, when it hit 6.9691, before reaching yesterday’s peak of 7.3662.
Chinese Economic Weakness Persists Despite Government Stimulus
Despite government stimulus measures introduced by China since September last year to support its economy, recent economic data indicate persistent weaknesses, increasing the need for further intervention by Chinese authorities. Key indicators reflecting this slowdown include:
- The Non-Manufacturing PMI fell to 50.2 in January, down from the previous reading of 52.2.
- The Manufacturing PMI declined to 49.1 in January, indicating contraction, and came in lower than both the forecast and previous reading (50.1).
- The Caixin Manufacturing PMI dropped to 50.1 in January, below both the forecast (50.6) and the previous reading (50.5).
Factors Supporting USD/CNY Upside Momentum
In addition to the weakness of the Chinese economy, several other factors have contributed to the bullish momentum of the USD/CNY pair:
- The strength of the U.S. dollar and the resilience of the U.S. economy.
- President Donald Trump’s decision to impose 10% tariffs on imported Chinese goods.
Markets are now awaiting the release of the Caixin Services PMI from China on Wednesday for further insights into the economic outlook.
Technical Analysis of USD/CNY
Technical indicators suggest that the USD/CNY pair may continue its upward trend, supported by:
- Bullish moving averages: The 20-day moving average is above the 50-day moving average, which is also above the 200-day moving average, confirming an upward trend.
- Relative Strength Index (RSI): Currently at 56, indicating positive momentum.
- Directional Movement Index (DMI): The DMI+ stands at 23, significantly higher than the DMI- at 14, reflecting strong buying pressure.
- Average Directional Index (ADX): At 30, suggesting a strong trend momentum.
Please note that this analysis is provided for informational purposes only and should not be considered as investment advice. All trading involves risk.


