Location & Language

Zenfinex Global Limited regulated by the Financial Services Authority (FSA) of Seychelles (SD092)

USD/CNY Outlook Amid Improving Chinese Economic Indicators

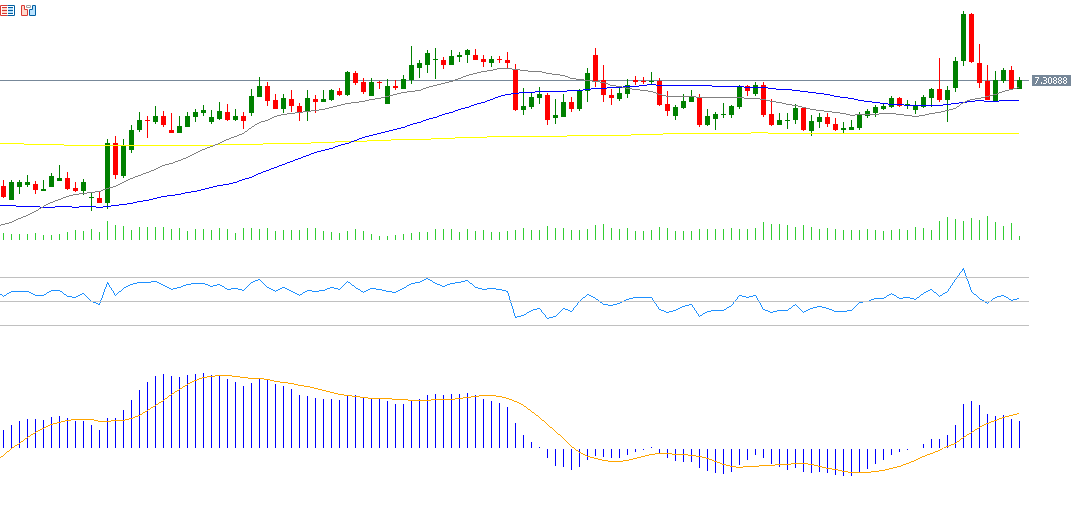
The U.S. dollar rose against the Chinese yuan last week, reaching 7.4290 — its highest level since November 2007, nearly 18 years ago. It is currently trading around the 7.3100 level.

Recently, China has seen a recovery in several key economic indicators:
• GDP grew by 5.4% year-over-year in Q1, exceeding expectations of 5.2%.
• Fixed asset investment rose by 4.2%, slightly above both forecasts and the previous reading (4.1%).
• Industrial production increased by 7.7% year-over-year, well above expectations and the previous reading (5.9%).
• Retail sales grew by 5.9% year-over-year, surpassing both forecasts (4.2%) and the previous figure (4.0%).
• The unemployment rate declined to 5.2%, below both expectations (5.3%) and the previous reading (5.4%).
• Exports surged by 12.4% year-over-year, significantly beating expectations (4.4%) and the prior reading (2.3%).

Investors are closely monitoring the ongoing trade tensions between the U.S. and China, as well as the reciprocal tariffs. This continues to create uncertainty and high volatility in financial markets, especially amid growing competition in areas like technology and artificial intelligence.

While USD/CNY price action remains somewhat uncertain, current technical indicators suggest bearish pressure on the pair:

  1. Relative Strength Index (RSI): Currently around 39 points, indicating bearish momentum.
  2. MACD: The blue line is below the orange signal line and in negative territory, pointing to continued negative momentum.

Please note that this analysis is provided for informational purposes only and should not be considered as investment advice. All trading involves risk.


Back

Popular Posts

Bullish Momentum for the U.S. Dollar Index Despite Economic Challenges

Overview of Last Week’s Key Economic Events

Bitcoin Roars Back: 39% Surge Since April Signals Bull Market Entry

Comprehensive Analysis of Crude Oil Price Movements: Geopolitical, Economic, and Technical Factors

Lorem Ipsum

Lorem ipsum dolor sit amet, consectetur adipiscing elit.

Here are some related articles you may find interesting:

Market Insights​

May 13, 2025

Bullish Momentum for the U.S. Dollar Index Despite Economic Challenges

The U.S. Dollar Index, which measures the greenback's performance against a basket of six major currencies, climbed yesterday to its highest level since April 11,...

Market Insights​

May 12, 2025

Overview of Last Week’s Key Economic Events

Last week witnessed several significant global economic developments. The U.S. Federal Reserve decided to keep interest rates unchanged, while labor market data showed improvement and...

Market Insights​

May 9, 2025

Bitcoin Roars Back: 39% Surge Since April Signals Bull Market...

Bitcoin prices reached $109,356—a record high registered on January 20 of this year—before retreating to around $75,000 on April 7. Currently, Bitcoin is trading above...

Market Insights​

May 8, 2025

Comprehensive Analysis of Crude Oil Price Movements: Geopolitical, Economic, and...

Crude oil prices have risen by approximately 8% since hitting a low of $58.44 on Monday this week, climbing to a peak of $63.17 as...

Ready to Elevate Your Trading Journey?

Open a Taurex account and start trading today.

We’re Sorry

Access to tradetaurex.com
is unavailable in your region

tradetaurex.com is required to abide by global laws and therefore the information on this site is not directed at residents of the United States, Canada, North Korea, Iran, Myanmar, Belgium, Spain, France, Japan, South Korea or any particular countries and is not intended for distribution to, or use by, any person in an country or jurisdiction where such distribution or use would be contrary to local law or regulation.

1 Hour Trading Consultation

This site is registered on wpml.org as a development site. Switch to a production site key to remove this banner.