
U.S. stock indices, specifically the S&P 500, Nasdaq 100, and Dow Jones, continued to reach record levels yesterday.
The Volatility Index (VIX) fell to 15.62 points, its lowest level in a month, indicating investor relief and strong demand for U.S. equities.
Expectations suggest that the positive momentum in U.S. stocks will continue in the near term despite elevated valuations, driven by several key factors:
- So far, 80% of S&P 500 companies that have reported earnings have exceeded analysts’ expectations. Markets are closely awaiting this week’s earnings from the major tech companies, the “Magnificent Seven,” with Microsoft, Meta, and Alphabet scheduled to report on Wednesday, October 29, and Apple and Amazon on Thursday, October 30. More important than the results themselves will be the forward guidance provided by the CEOs.
- The headline Consumer Price Index (CPI) rose 3.0% year-over-year, below expectations (3.1%) but higher than the previous reading (2.9%). The core CPI also rose 3.0% year-over-year, below both expectations and the previous reading (3.1%), reinforcing expectations that the Federal Reserve may cut interest rates by 25 basis points at its meeting on Wednesday.
- Trade tensions between the U.S. and China have eased, with markets anticipating the upcoming meeting between the U.S. President and the Chinese President on Thursday in South Korea.
- Additionally, large technology stocks related to artificial intelligence continue to show positive momentum. The “Magnificent Seven” (MAGS) index reached a record level yesterday, up approximately 24% year-to-date. The Philadelphia Semiconductor Index (SOX) also hit record highs yesterday, rising about 44% since the beginning of the year, reflecting strong demand for AI-related products and significant investment flows into the sector’s infrastructure.
The banking sector is also performing positively, with the KBW U.S. Banks Index rising roughly 18% year-to-date. The industrial sector has seen similar gains, with the XLI industrial ETF reaching a record level yesterday, up about 18% from the start of the year.
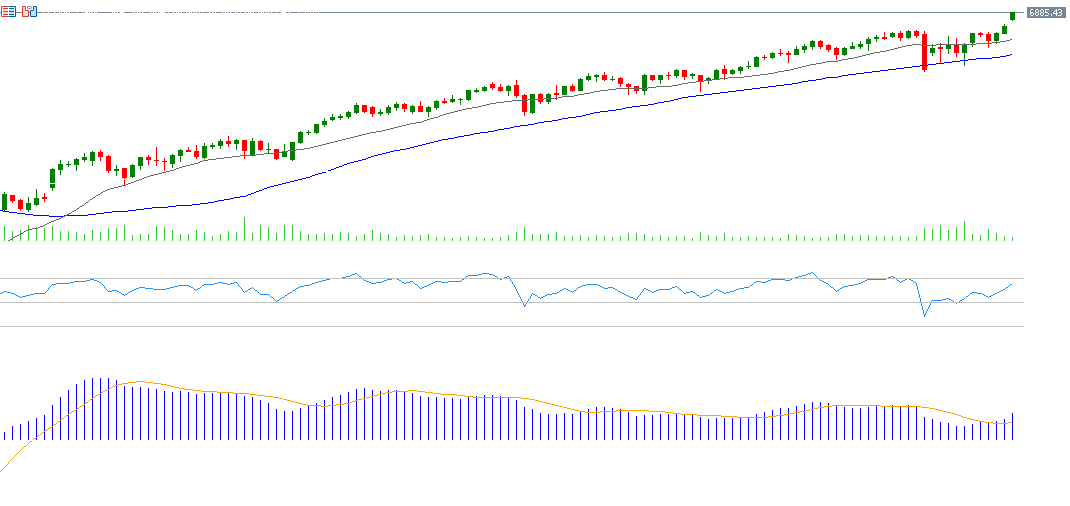
From a technical perspective, indicators suggest that the S&P 500’s upward trend is likely to continue due to:
- The alignment of the 20-, 50-, and 200-day moving averages, with the 20-day average above the 50-day, which is above 200-day, indicating a positive technical arrangement.
- The Relative Strength Index (RSI) is currently at 68 points, reflecting strong bullish momentum.
- A bullish crossover between the MACD and the signal line, further supporting the positive momentum for the S&P 500.
Please note that this analysis is provided for informational purposes only and should not be considered as investment advice. All trading involves risk.

