
Crude oil prices have been trading in a sideways range between $62 and $66.75 over the past month, currently hovering around the $65 mark. There are three notable peaks around the $66.75 resistance level, indicating that the sideways trend is likely to persist in the near term, especially amid the ongoing uncertainty surrounding the oil market, which is being influenced by various conflicting factors that are keeping prices within this range.
Bearish Factors Pressuring Oil Prices:
- OPEC+ Agreement to Increase Supply: The alliance has agreed to a new production increase of 411,000 barrels per day in July, marking the third consecutive monthly rise.
- Weak Global Demand, Especially from China: The world’s largest oil importer has recently released disappointing economic data. Most notably, the Caixin Manufacturing PMI dropped to 48.3—well below expectations (50.7) and the previous reading (50.4)—its lowest level since September 2022.
Bullish Factors Supporting Oil Prices:
- Uncertainty Around U.S.-Iran Nuclear Negotiations: With former President Trump reaffirming that he will not allow Iran to enrich uranium under any potential deal, geopolitical risk remains elevated.
- Escalating Geopolitical Tensions Between Russia and Ukraine: Ongoing conflict adds to market volatility and supports higher oil prices.
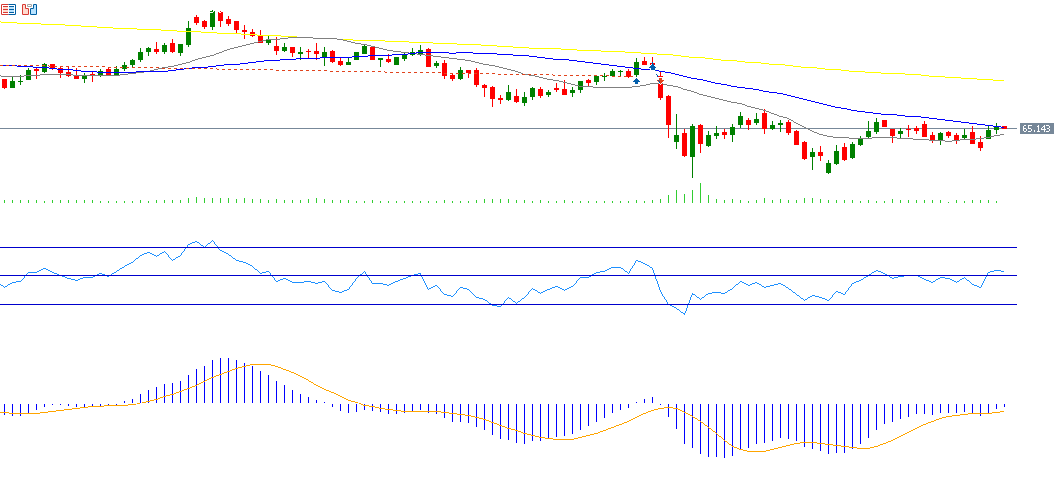
Technical Analysis:
Crude oil is currently trading below the 50-day moving average (blue) at $65.61, but above a key support level, which is the 20-day moving average (gray) at $64.65. The Death Cross (a bearish crossover where the short-term moving average crosses below the long-term moving average) between the 20-day and 50-day MAs remains in place. The next challenge for bulls is to reverse this pattern into a Golden Cross, which would signal a shift to a bullish trend.
As for the Relative Strength Index (RSI), it is hovering around 50 points, indicating a neutral stance, with no clear directional bias in price action.
Please note that this analysis is provided for informational purposes only and should not be considered as investment advice. All trading involves risk.

