Forex Terminology: A Beginner’s Glossary of Forex Terms and Abbreviations
Understanding forex terminology is one of the most important foundations a trader can build before entering the currency market. The Forex market is huge. About $8.56 trillion is traded every day, making it the biggest and most active financial market in the world. With over 180 currencies traded across different time zones, there are many terms to learn, which can feel confusing for beginners.
Learning the language of Forex is very important. Around 76% of retail CFD accounts lose money, and many of those losses come from not understanding key concepts like leverage, margin, and order types. Knowing the right terms helps you read charts, understand news, and manage risk more clearly.
This guide covers all the important Forex trading terminology you need. Think of it as your practical Forex trading glossary. Whether you are searching for a quick definition or a deeper explanation of the FX terms and abbreviations you keep encountering on trading platforms, this guide has you covered.
Key Forex Trading Terms Every Trader Should Know: Quick Reference Table
Use this quick-reference table to understand common forex keywords, terms and concepts before exploring the detailed explanations below.
| Term | Category | Definition | Example |
| Currency Pair | Basic | Two currencies quoted together showing relative value | EUR/USD at 1.1200 |
| Base Currency | Basic | The first currency in a pair — what you buy or sell | In GBP/JPY, GBP is the base |
| Quote Currency | Basic | The second currency — shows the price of the base | In GBP/JPY, JPY is the quote |
| Major Pairs | Basic | Pairs including USD and another high-volume currency | EUR/USD, GBP/USD, USD/JPY |
| Minor Pairs | Basic | Two major currencies without USD | EUR/GBP, AUD/NZD |
| Exotic Pairs | Basic | Major currency paired with a developing-market currency | USD/ZAR, USD/MXN |
| Pip | Basic | Smallest standard price movement (4th decimal; 2nd for JPY) | 1.1200 → 1.1210 = 10 pips |
| Pipette | Basic | One-tenth of a pip (5th decimal place) | 1.12005 → 1.12006 |
| Standard Lot | Basic | 100,000 units of the base currency; each pip ≈ $10 | 1 lot EUR/USD = 100,000 EUR |
| Mini Lot | Basic | 10,000 units; each pip ≈ $1 | 0.1 lots |
| Micro Lot | Basic | 1,000 units; each pip ≈ $0.10 | 0.01 lots |
| Spread | Basic | Difference between bid and ask price — the cost of a trade | Bid 1.1200 / Ask 1.1202 = 2 pips |
| Leverage | Basic | Controls a larger position with a smaller deposit | 1:100 → $1,000 controls $100,000 |
| Margin | Basic | Collateral required to open/maintain a leveraged position | At 1:100, margin ≈ $1,000 per lot |
| Margin Call | Basic | Broker alert when equity falls below required maintenance margin | Forced closure of positions |
| Market Order | Orders & Execution | Executed immediately at the best available price | Buy EUR/USD at market |
| Limit Order | Orders & Execution | Buy or sell at a specific price or better | Buy limit at 1.1150 |
| Stop Order | Orders & Execution | Becomes a market order once a set price is reached | Buy stop at 1.1250 |
| Stop-Loss Order | Orders & Execution | Closes a trade automatically at a set level to cap losses | Stop-loss 30 pips below entry |
| Take-Profit Order | Orders & Execution | Closes a trade automatically when target profit is reached | Take-profit 60 pips above entry |
| Slippage | Orders & Execution | Difference between expected and actual fill price | Order at 1.1200, filled at 1.1203 |
| Liquidity | Orders & Execution | How easily a currency can be traded without affecting its price | EUR/USD is the most liquid pair |
| Interest Rates | Fundamental Analysis | Central bank rates that influence currency demand | Fed raises rates → USD strengthens |
| Inflation (CPI) | Fundamental Analysis | Rate at which purchasing power declines; measured by CPI | Rising CPI may signal rate hikes |
| GDP | Fundamental Analysis | Total economic output of a country over a period | Strong US GDP → bullish for USD |
| NFP | Fundamental Analysis | Non-Farm Payrolls — US jobs data released first Friday monthly | Strong NFP → USD rally |
| PPI | Fundamental Analysis | Producer Price Index — measures wholesale-level price changes | Rising PPI may lead to higher CPI |
| PMI | Fundamental Analysis | Purchasing Managers’ Index — survey of manufacturing/services activity | PMI above 50 = expansion |
| FOMC | Fundamental Analysis | Federal Open Market Committee — sets US interest rate policy | FOMC meeting → USD volatility |
| ECB | Fundamental Analysis | European Central Bank — sets monetary policy for the Eurozone | ECB rate decision → EUR moves |
| BOE | Fundamental Analysis | Bank of England — sets UK monetary policy | BOE hike → GBP strengthens |
| BOJ | Fundamental Analysis | Bank of Japan — sets Japanese monetary policy | BOJ intervention → JPY spikes |
| ISM | Fundamental Analysis | Institute for Supply Management — US manufacturing/services surveys | ISM Manufacturing PMI |
| ADP | Fundamental Analysis | Automatic Data Processing — private US employment report released before NFP | ADP as NFP preview |
| PCE | Fundamental Analysis | Personal Consumption Expenditures — the Fed’s preferred inflation gauge | Core PCE watched closely by Fed |
| CCI | Fundamental Analysis | Consumer Confidence Index — measures household economic optimism | Rising CCI → positive for USD |
| RSI (Retail Sales Index) | Fundamental Analysis | Measures monthly change in retail sector sales | Strong retail sales → bullish for currency |
| ECI | Fundamental Analysis | Employment Cost Index — tracks changes in labour costs | Rising ECI may signal wage inflation |
| JOLTS | Fundamental Analysis | Job Openings and Labor Turnover Survey — measures US labour demand | High JOLTS → tight labour market |
| HICP | Fundamental Analysis | Harmonised Index of Consumer Prices — Eurozone inflation measure | ECB uses HICP for rate decisions |
| QE | Fundamental Analysis | Quantitative Easing — central bank buys assets to inject liquidity | QE tends to weaken the currency |
| QT | Fundamental Analysis | Quantitative Tightening — central bank reduces its balance sheet | QT tends to strengthen the currency |
| Hawkish | Fundamental Analysis | Central bank stance favouring higher rates / tighter policy | Hawkish Fed → USD bullish |
| Dovish | Fundamental Analysis | Central bank stance favouring lower rates / stimulus | Dovish ECB → EUR bearish |
| Economic Calendar | Fundamental Analysis | Schedule of upcoming data releases and central bank meetings | Plan trades around key events |
| Support | Technical Analysis | Price level where buying demand has historically halted declines | EUR/USD bounces at 1.0800 |
| Resistance | Technical Analysis | Price level where selling pressure has stalled rallies | EUR/USD rejected at 1.1400 |
| Uptrend | Technical Analysis | Higher highs and higher lows | Series of rising peaks and troughs |
| Downtrend | Technical Analysis | Lower highs and lower lows | Series of declining peaks and troughs |
| SMA | Technical Analysis | Simple Moving Average — equal weight to all periods | 200 SMA as long-term trend filter |
| EMA | Technical Analysis | Exponential Moving Average — more weight on recent prices | 20 EMA for short-term direction |
| RSI (Relative Strength Index) | Technical Analysis | Momentum oscillator (0–100); above 70 = overbought, below 30 = oversold | RSI at 75 may signal a pullback |
| MACD | Technical Analysis | Tracks relationship between two EMAs (12 & 26 period) | Signal line crossover → trade signal |
| Candlestick | Technical Analysis | Chart element showing open, high, low, close for a time period | Doji, hammer, engulfing, shooting star |
| Risk-to-Reward Ratio | Risk Management | Compares potential profit to potential loss | Risk $50, target $100 = 1:2 |
| Position Size | Risk Management | Volume of a trade based on account balance and risk tolerance | Risk 1–2% of account per trade |
| Drawdown | Risk Management | Decline in account value from peak to subsequent low | $10,000 → $8,500 = 15% drawdown |
| Overtrading | Risk Management | Placing excessive trades driven by emotion | Set a 2% daily loss cap |
| Trading Plan | Risk Management | Written framework for strategy, rules, and goals | Defines what, when, and how you trade |
| Trading Journal | Risk Management | Record of every trade with entry, exit, rationale, and lessons | Review weekly to spot patterns |
| Fear & Greed | Risk Management | Primary emotional drivers of retail losses | A structured plan is the best antidote |
| Central Banks | Participants & Sessions | Most powerful forex players; influence rates and policy | Fed, ECB, BoE, BoJ, RBA |
| Commercial Banks | Participants & Sessions | Execute large currency transactions for clients and own desks | JP Morgan, Citi, Deutsche Bank |
| Institutional Investors | Participants & Sessions | Hedge funds, pension funds, sovereign wealth funds | Large moves on daily/weekly charts |
| Retail Traders | Participants & Sessions | Individuals trading through online brokers | Retail volume >$30T/month in Q2 2025 |
| Liquidity Providers | Participants & Sessions | Tier-1 banks supplying bid/ask pricing to brokers | More LPs = tighter spreads |
| Sydney Session | Participants & Sessions | Opens the forex week; ~10 PM – 7 AM UTC; lower volatility | AUD/USD, NZD/USD most active |
| Tokyo Session | Participants & Sessions | 12 AM – 9 AM UTC; JPY pairs most active | USD/JPY, EUR/JPY |
| London Session | Participants & Sessions | 8 AM – 5 PM UTC; ~43% of global volume; most liquid session | EUR/GBP pairs peak activity |
| New York Session | Participants & Sessions | 1 PM – 10 PM UTC; USD pairs dominate; London–NY overlap = highest volatility | NFP, CPI, GDP released here |
Basic Forex Terms Every Trader Should Understand
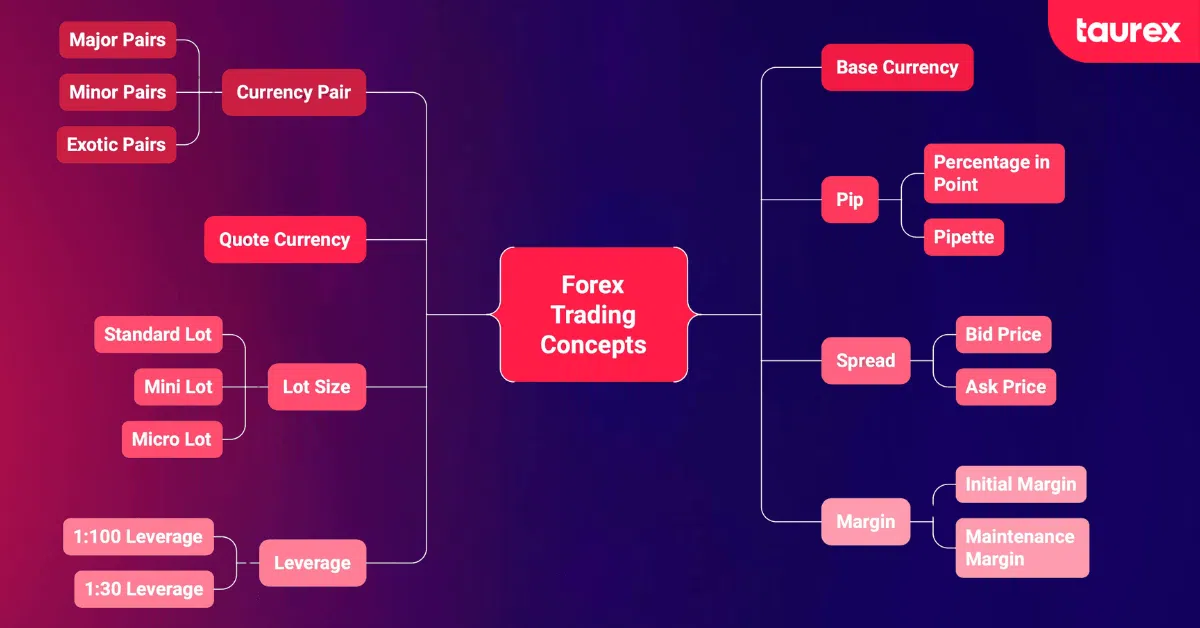
Before placing a trade, it is important to understand the basic terms used across the Forex market. These currency trading terms explain how currencies are quoted, how trade sizes are measured and how trading costs, leverage and margin work.
Currency Pair
A currency pair is the core of every Forex trade. It shows the value of one currency compared to another. The first currency is called the base currency, and the second is called the quote currency. For example, EUR/USD at 1.1200 means that one euro can buy 1.12 US dollars.
Currency pairs are grouped into three main types. Major pairs include the US dollar and another high-activity currency, such as GBP/USD or USD/JPY. Minor pairs are made of two major currencies but do not include the US dollar, like EUR/GBP. Exotic pairs combine a major currency with one from a developing market, such as USD/ZAR or USD/MXN.
Base Currency And Quote Currency
The base currency is the first currency in a pair. It shows what you are buying or selling. The quote currency is the second currency and shows the price of the base currency. For example, if GBP/JPY is 188.50, it means one British pound costs 188.50 Japanese yen. Knowing which currency is which helps you read Forex quotes correctly and prevents mistakes when placing trades.
Pip
A pip, which stands for “percentage in point,” is the smallest usual change in a Forex price. For most currency pairs, it is the fourth decimal place, or 0.0001. For example, if EUR/USD moves from 1.1200 to 1.1210, that is a change of 10 pips. On a standard lot, those 10 pips would equal about $100 in profit or loss, depending on the trade direction.
There is also a pipette, which is the fifth decimal place and equals one-tenth of a pip. The exception is pairs with the Japanese yen. For these pairs, prices use two decimal places, so a pip for USD/JPY is 0.01.
Lot Size
A lot is the standard way to measure the size of a trade. A standard lot is 100,000 units of the base currency. A mini lot is 10,000 units, and a micro lot is 1,000 units. Some brokers also offer nano lots of 100 units, usually through special cent accounts.
The lot size you choose affects how much each pip is worth and how much risk you take on a trade. For example, trading a standard lot on EUR/USD makes each pip worth about $10, while a micro lot makes each pip worth about $0.10. You can also use a lot size calculator to pick a position that matches your risk level.
Spread
The Forex spread is the difference between the bid price, which is what buyers will pay, and the ask price, which is what sellers want. It is the main cost of making a trade. When spreads are small, it costs less to enter and exit trades. Major pairs like EUR/USD usually have the smallest spreads, while exotic pairs like EUR/NOK have bigger spreads.
Spreads can change depending on market conditions. They often get wider during important news events, low trading hours, or sudden market shocks. Forex brokers like Taurex offer spreads starting from 0.0 pips on certain account types, which can help reduce trading costs for active traders.
Leverage
Leverage lets you control a bigger trade with a smaller amount of your own money. For example, with 1:100 leverage, a $1,000 deposit can control a $100,000 position. Leverage can make profits bigger, but it can also make losses bigger.
Leverage limits depend on where you trade. In the UK and Europe, major pairs are limited to 1:30, while in the US, the limit is 1:50. Some offshore brokers offer higher amounts. Taurex offers leverage up to 1:2000 for eligible accounts. It is important to understand how leverage works and how it affects your account before trading with real money.
Margin
Margin is the money you need to put up to open and keep a leveraged trade. It works like collateral, not a fee. There are two main types. Initial margin is the amount needed to start a trade, and maintenance margin is the minimum balance needed to keep it open.
If your account falls below the maintenance margin, you might get a margin call. This means the broker could close some or all of your trades to prevent bigger losses. Taurex provides more details about how its dynamic margin system works for different accounts.
Forex Order Types and Execution Terms
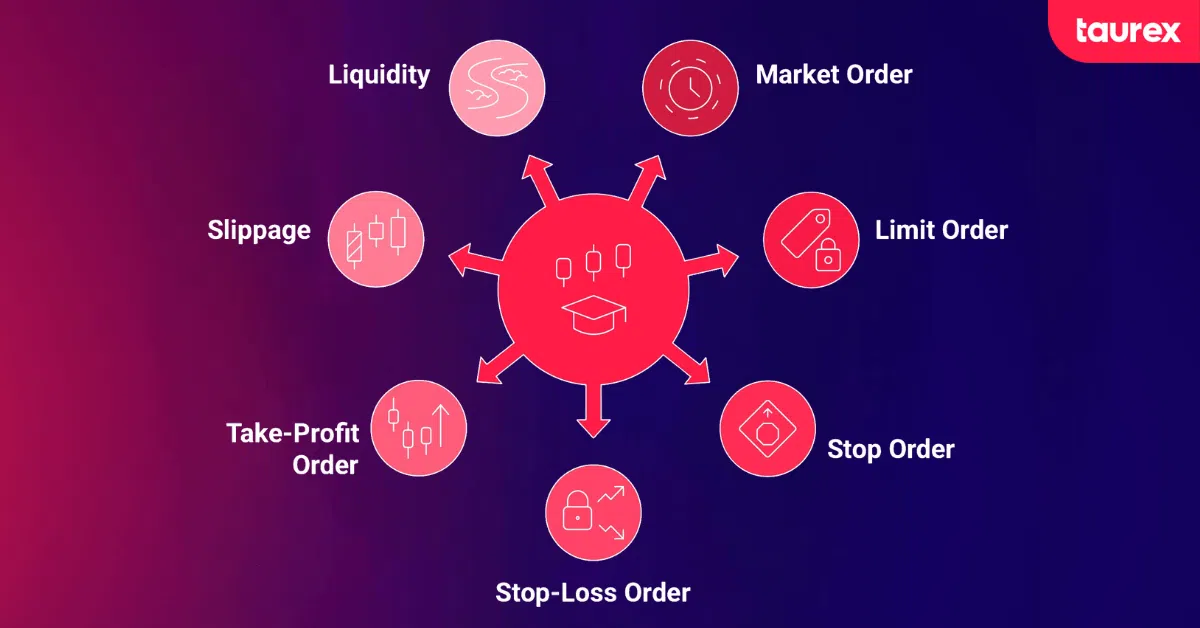
Understanding different types of Forex orders, including how a contingent order in Forex works, helps traders enter the market with control instead of just reacting to price movements. Some orders execute immediately, while pending orders remain inactive until the market reaches a specified price or another predefined condition is met
Market Order
A market order is executed immediately at the best available price. Use it when speed matters more than the exact price.
The price displayed when the order is submitted is not guaranteed. During periods of high volatility or low liquidity, the market may move before the order is filled, resulting in a different execution price.
Limit Order
A limit order tells your broker to buy or sell only at a specific price or better. A buy limit is set below the current price, and a sell limit is set above it. The advantage is that you get the exact price you want, but the downside is that the market may never reach that price, leaving the order unfilled.
Stop Order
A stop order becomes a market order once the price reaches a certain level. Traders often use it for breakout strategies.
A buy stop is placed above the current market price, while a sell stop is placed below it. These orders are commonly associated with breakout strategies.
Stop-Loss Order
A stop-loss order automatically closes your trade at a set level to limit losses. It is one of the most important tools for managing risk. Keep in mind that around 60% of stop-loss orders are triggered by short-term price swings rather than real trend changes. This is why choosing how far away to place your stop matters.
Take-Profit Order
A take-profit order closes your trade automatically when a target price is reached. It locks in profits without needing to watch the market. Using take-profit orders together with stop-loss orders creates a clear plan for how much you can gain or lose on each trade.
Trailing Stop
A trailing stop is a stop-loss that adjusts as the market moves in a favourable direction. It follows the current price at a predefined distance but does not move backwards when the market reverses.
For example, a 30-pip trailing stop on a long position may move higher as the currency pair rises. If the market then reverses by the specified distance, the position may be closed. The exact way trailing stops operate can depend on the trading platform.
Contingent Orders
A contingent order becomes active only after a predefined condition is met. These orders allow traders to connect multiple instructions or plan how a position should be managed after an entry order is executed.
One-cancels-the-other, or OCO, is a common example. It links two orders so that when one is executed, the other is cancelled automatically. The order types available may differ between brokers and trading platforms.
Slippage
Slippage happens when your trade is filled at a different price than expected. It usually occurs during high volatility, around big news events, or when trading volume is low. Faster execution platforms tend to reduce slippage.
Liquidity
Liquidity shows how easily a currency can be bought or sold without changing its price. High liquidity means tight spreads, fast trade execution, and less slippage. The Forex market is very liquid, but not all sessions are the same.
Fundamental Analysis Terms For Forex Traders
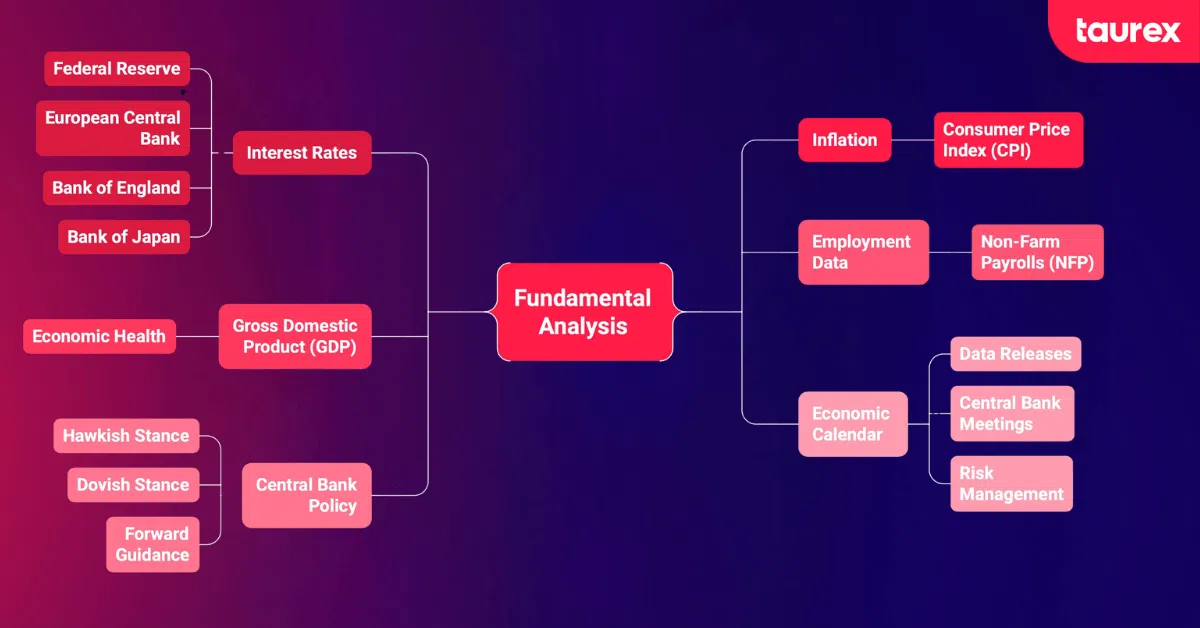
Fundamental analysis examines economic data, monetary policy and other factors that may affect a currency’s value. Traders follow indicators such as interest rates, inflation, economic growth and employment data to understand economic conditions and possible changes in currency demand.
Interest Rates
Central bank interest rates are one of the biggest influences on currency prices. When a central bank raises rates, it can attract foreign investment, increasing demand for that currency. Traders watch announcements from the Federal Reserve (USD), the European Central Bank (EUR), the Bank of England (GBP), and the Bank of Japan (JPY).
Inflation
Inflation shows how fast a currency loses purchasing power. Higher inflation can lead to rate hikes, which often make a currency stronger. The Consumer Price Index (CPI) is the main measure of inflation in Forex. Surprising CPI numbers can cause big price moves in major pairs.
Gross Domestic Product (GDP)
GDP measures a country’s total economic output over a given period. Strong GDP growth generally signals economic health and tends to be positive for that country’s currency. GDP releases are classified as high-impact events on any economic calendar.
Employment Data
Employment reports provide information on job creation, unemployment, wages, and labour market conditions. These figures can affect expectations for economic growth, inflation and future interest-rate decisions.
Non-Farm Payrolls is part of the US Employment Situation report and is one of the most closely followed employment indicators in the Forex market. It is generally released monthly, according to the Bureau of Labor Statistics schedule, rather than on a fixed first Friday each month. For example, the January 2026 report was released on Wednesday, February 11 and the June 2026 report was released on Thursday, July 2.
Employment data that differs significantly from forecasts can lead to increased market volatility. Traders can learn more about managing these events in the Forex news trading strategy guide.
Central Bank Policy
Central banks use interest rates, asset-purchase programmes and other monetary-policy tools to manage inflation and economic conditions. Their decisions and communications can influence exchange rates by changing expectations for future borrowing costs and investment returns.
A hawkish stance generally indicates that a central bank is concerned about inflation and may favour higher interest rates or tighter policy. A dovish stance generally indicates support for lower rates or more accommodative policy.
These signals do not guarantee a particular currency movement. Traders also consider what the market expects, how the policy compares with other central banks and what policymakers communicate about future decisions. For example, the Federal Open Market Committee publishes statements and guidance that can influence expectations for US monetary policy.
Economic Calendar
An economic calendar lists upcoming data releases, central bank meetings, and events that can affect markets. Traders use it to plan trades, adjust position sizes, or avoid the market before big news. Knowing what is coming is a simple but effective way to manage risk.
Below are common forex abbreviations you will see on an economic calendar:
- NFP — Non-Farm Payrolls
- CPI — Consumer Price Index
- GDP — Gross Domestic Product
- PPI — Producer Price Index
- PMI — Purchasing Managers’ Index
- FOMC — Federal Open Market Committee
- ECB — European Central Bank
- BOE — Bank of England
- BOJ — Bank of Japan
- ISM — Institute for Supply Management
- ADP — Automatic Data Processing (private employment report)
- PCE — Personal Consumption Expenditures
- CCI — Consumer Confidence Index
- RSI — Retail Sales Index
- ECI — Employment Cost Index
- JOLTS — Job Openings and Labor Turnover Survey
- HICP — Harmonised Index of Consumer Prices (used in the Eurozone)
- QE — Quantitative Easing
- QT — Quantitative Tightening
Key Technical Analysis Terms Every Forex Trader Must Know
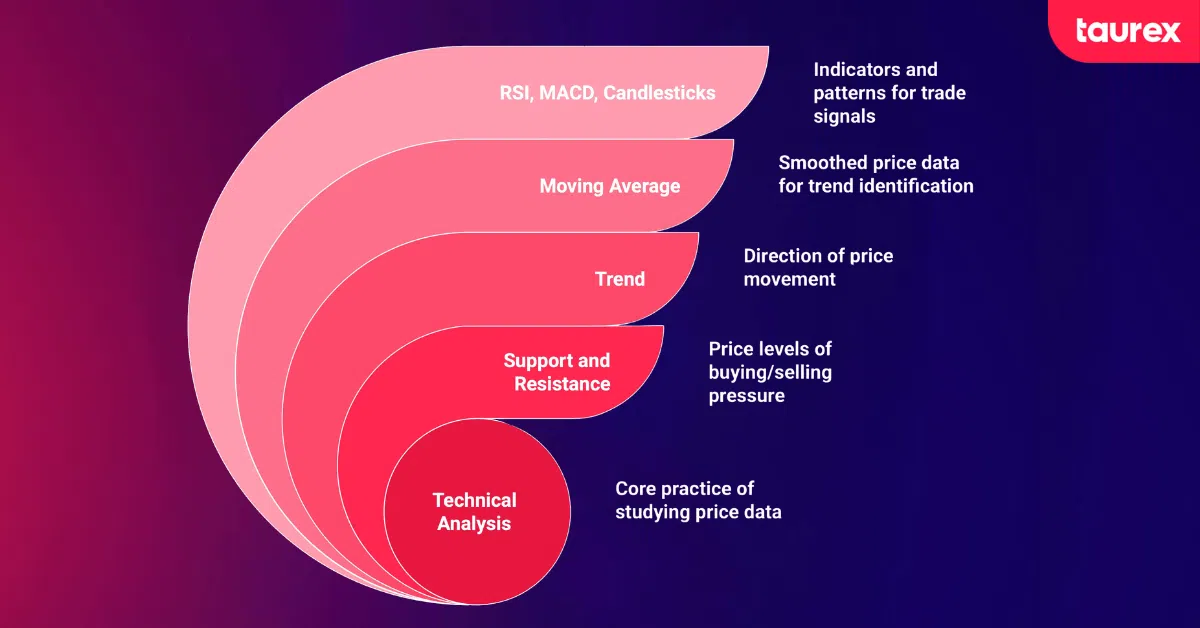
Technical analysis examines historical price movements, chart patterns and indicators to assess market behaviour and identify potential trading setups. Understanding these terms can help traders read Forex charts and interpret price movements more effectively.
Support And Resistance
Support is a price level where buying demand has historically halted or reversed a decline. Resistance is the opposite: a level where selling pressure has historically stalled or reversed a rally. These two concepts are foundational to nearly every technical strategy, from order block trading to simple trend-following.
Trend
An uptrend consists of higher highs and higher lows. A downtrend consists of lower highs and lower lows. When the price consolidates between support and resistance without a clear directional bias, the market is ranging. Trading in the direction of the prevailing trend remains one of the most widely applied principles in Forex.
Moving Average
A moving average smooths out price data over a specific number of periods to reveal the underlying trend. The Simple Moving Average (SMA) gives equal weight to all periods, while the Exponential Moving Average (EMA) puts more weight on recent prices, making it quicker to react. The 20, 50, and 200-period moving averages are among the most commonly referenced by traders across all timeframes.
Relative Strength Index (RSI)
RSI is a momentum indicator that measures how fast and how far prices are moving. It goes from 0 to 100. Readings above 70 suggest the pair may be overbought, and readings below 30 suggest it may be oversold. Traders also use it to find divergences, when price and RSI move in opposite directions.
Moving Average Convergence Divergence (MACD)
The MACD tracks the relationship between two EMAs, typically the 12-period and 26-period. Signal line crossovers and histogram divergences form the primary trade signals. It is one of the most broadly used momentum indicators in Forex and works well as a confirmation tool alongside other forms of analysis.
Candlestick Patterns
Each candlestick displays four data points: open, high, low, and close for a given time period. Patterns like the doji, hammer, engulfing, and shooting star are used to signal potential reversals or continuations. Japanese candlestick charts have become the industry standard for price visualisation in Forex, and reading them fluently is a skill that develops with practice.
Traders can learn more about these formations in the guide to reading candlestick charts in Forex.
Breakout and Pullback
A breakout occurs when price moves beyond an established support level, resistance level, trendline or chart-pattern boundary. Traders may look for confirmation such as a candle close beyond the level or continued momentum after the initial movement.
A pullback is a temporary movement against the prevailing trend. For example, price may decline briefly during an uptrend before continuing higher. A pullback trading strategy aims to identify potential entries during these temporary movements. However, a pullback does not always result in trend continuation because it may develop into a larger reversal.
Risk Management and Trading Psychology Terms
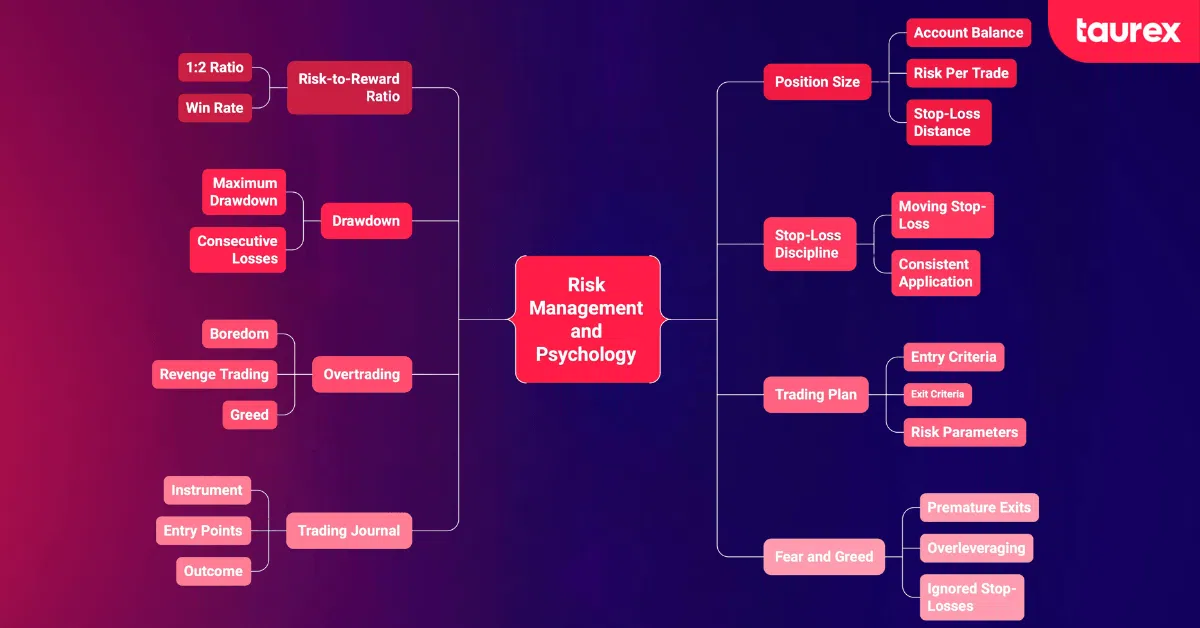
This section may well be the most valuable one in this guide. Risk management is the discipline that keeps traders in the market long enough to improve, and trading psychology determines whether that discipline holds up under pressure.
Risk-to-Reward Ratio
The risk-to-reward ratio compares the amount a trader could lose with the potential return of a trade. For example, risking $50 to target a potential return of $100 creates a risk-to-reward ratio of 1:2.
Traders may use a minimum ratio as part of their Forex risk management rules. However, an appropriate ratio depends on the strategy, expected win rate, market conditions and trade setup. A favourable ratio does not guarantee that a strategy will be profitable.
Position Size
Position size is how much of a currency you trade. It should be based on your account balance, how much you are willing to risk per trade, and your stop-loss distance. A common rule is to risk no more than 1 to 2% of your account on a single trade. Position sizing tools can make this easier.
Drawdown
Drawdown in forex is the decline in account value from a peak to a subsequent low point. Maximum drawdown measures the worst-case scenario for a given strategy. To put this in perspective, risking 5% of your account per trade could wipe out the account in roughly 20 consecutive losses, which is why smaller risk percentages provide a wider margin for error.
Stop-Loss Discipline
Placing a stop-loss is one thing. Respecting it is another. One of the most common and costly errors is moving a stop-loss further from entry after a trade goes against you, effectively increasing risk on a position that is already losing. Consistent application, trade after trade, is what separates structured Forex risk management from wishful thinking.
Overtrading
Overtrading happens when you place too many trades, often because of emotions. Boredom, trying to win back losses, or greed during a hot streak are common causes. Setting a daily or weekly loss limit, such as 2% of your account per day, can help prevent this.
Overtrading may also be connected to FOMO in trading or attempts to recover a recent loss.
Trading Plan
A trading plan is a written framework that spells out your strategy, entry and exit criteria, risk parameters, the instruments you trade, and your goals. Without one, every trade becomes a reaction rather than a decision. If you are exploring how to become a trader, building a plan is one of the first steps worth taking.
Trading Journal
A trading journal records each trade, including the instrument, entry and exit points, position size, reason for the trade, outcome, and lessons learned. Reviewing your journal regularly helps you spot Forex trading mistakes and improve faster.
Fear And Greed In Trading
Fear can lead traders to close positions prematurely, avoid valid setups or reduce position sizes outside their planned rules. Greed can contribute to excessive leverage, larger position sizes or remaining in a position after its planned exit point.
Revenge trading occurs when a trader places impulsive trades after a loss in an attempt to recover money quickly. It may lead to increased position sizes, ignored stop-losses and further overtrading.
These emotions do not automatically result in losses, but they can affect how consistently a trader follows their strategy. Predefined risk limits, a trading plan and regular journal reviews may help traders recognise emotionally driven decisions.
Terms Related To Forex Market Participants And Trading Sessions
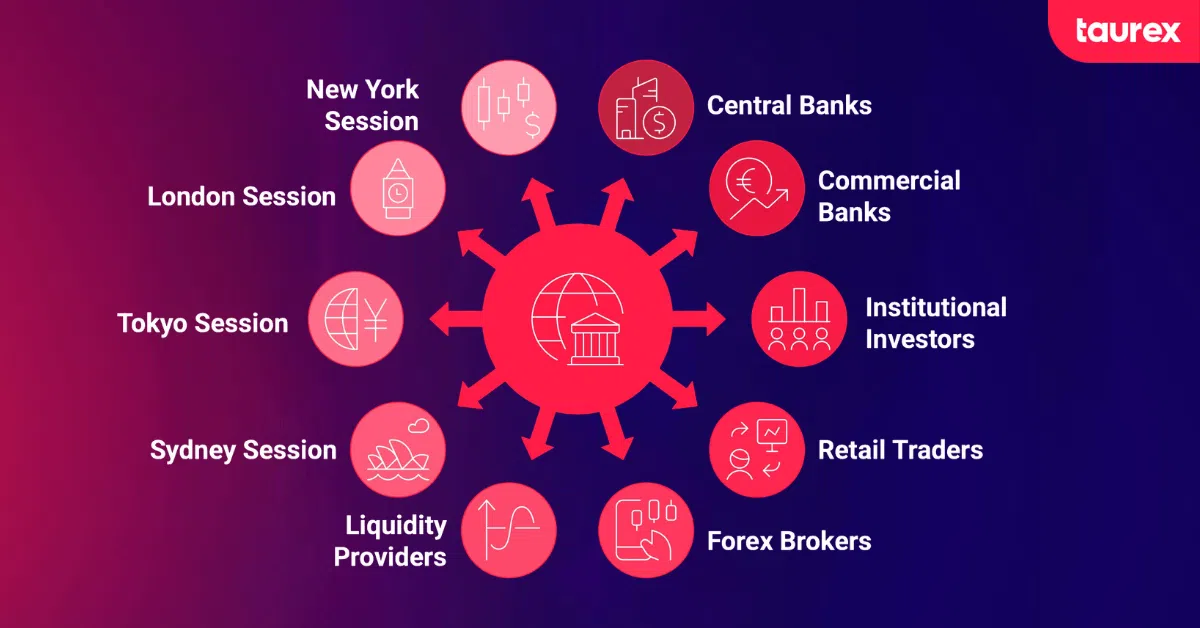
The market is shaped by a wide mix of Forex market participants, each operating with different objectives and timescales. Knowing who trades and when helps you anticipate market behaviour and understand why certain sessions produce more volatility than others. For a detailed breakdown of session timing, see the Forex market hours guide.
Central Banks
Central banks are the most powerful players in the Forex market. They use interest rate decisions, open market operations, and, on occasion, direct currency intervention to influence exchange rates. The Federal Reserve (USD), European Central Bank (EUR), Bank of England (GBP), Bank of Japan (JPY), and Reserve Bank of Australia (AUD) are among the most closely watched.
Commercial Banks
Commercial banks execute massive currency transactions on behalf of corporate clients and through their own proprietary trading desks. Firms like JP Morgan, Citi, Deutsche Bank, and UBS rank among the largest Forex dealers globally and are responsible for a substantial share of interbank market flow.
Institutional Investors
Hedge funds, pension funds, and sovereign wealth funds trade large positions that can create sustained directional pressure on currency pairs. Their activity often precedes the kind of large moves visible on daily and weekly charts.
Retail Traders
Retail traders are individuals who trade through online brokers. Retail Forex and CFD trading reached over $30 trillion per month in the second quarter of 2025, thanks to mobile platforms and better access to education.
Forex Brokers
Brokers act as intermediaries connecting retail traders to the interbank market. They provide trading platforms, leverage, and market access. Regulated brokers offer additional protections such as segregated client funds and insurance coverage. If you are evaluating options, choosing a Forex broker that fits your trading style and regulatory preferences is a decision worth taking seriously. You can start Forex trading with Taurex across multiple account types and platforms, including MT4 and MT5.
Liquidity Providers
Liquidity providers are typically tier-1 banks and large financial institutions that supply bid and ask pricing to brokers. The number and depth of a broker’s liquidity providers directly affect the tightness of spreads and the quality of execution that retail traders experience.
Sydney Trading Session
The Sydney session opens the Forex trading week at approximately 10 PM UTC on Sunday and runs until about 7 AM UTC. Volatility tends to be lower compared to other sessions, and the most active pairs are typically AUD/USD and NZD/USD.
Tokyo Trading Session
The Tokyo session runs from 12 AM to 9 AM UTC. Yen pairs like USD/JPY and EUR/JPY are most active. Prices from this session often set reference points for London and New York traders.
London Trading Session
Running from 8 AM to 5 PM UTC, the London session is the deepest and most liquid of all four sessions, handling approximately 43% of global Forex volume. EUR and GBP pairs experience peak activity, and institutional order flow is at its heaviest.
New York Trading Session
The New York session runs from 1 PM to 10 PM UTC and is the second largest by volume. USD pairs dominate, and the overlap with London from 1 to 5 PM UTC produces the highest-volatility window of the entire trading day. Major US economic releases, including NFP, CPI, and GDP, all fall within this session.
Practise Forex Terminology With a Demo Account
Learning Forex terminology can take time, but it may make trading feel much clearer and more manageable. Understanding key terms can help you read charts, follow market news, and make more informed decisions over time.
Beginners can open a demo account with Taurex to explore the platform, practise placing orders and test trading strategies using virtual funds before trading with real money. Demo conditions may differ from live trading, so results should not be treated as an indication of future performance.
FAQ
Why is it important to learn Forex terminology?
Learning Forex terminology can help traders understand how currency pairs, trading platforms and order types work. Knowing terms such as leverage, margin, spread and stop-loss can also make it easier to interpret market analysis and understand the risks involved in a trade.
What is the difference between forex terms and forex abbreviations?
Forex terms describe concepts used in currency trading, such as spread, leverage, margin, pip and lot size. Forex abbreviations are shortened names for indicators, institutions and economic data, such as RSI, MACD, CPI, NFP and FOMC.
What is a forex trading glossary?
A forex trading glossary is a reference that explains common forex terms and abbreviations in one place. Traders can use it to quickly look up unfamiliar concepts related to currency pairs, trading orders, technical analysis, fundamental analysis and risk management. FundedNext similarly structures its terminology content as a forex trading glossary for quick reference.
What is the most important Forex term for beginners to understand?
Beginners should start with currency pair, base currency, quote currency, pip, spread, lot size, leverage, margin, stop-loss and position size. These terms explain how Forex prices are quoted, how trading costs are calculated and how much capital may be placed at risk.
What are the most common Forex abbreviations?
Common Forex abbreviations include CPI, GDP, NFP, FOMC, RSI, MACD and PCE. Their meanings depend on the context, as some relate to economic data while others refer to technical indicators.
What is the difference between a pip and a spread in Forex?
A pip is the smallest standard unit of price movement in a currency pair, usually 0.0001 for most pairs. The spread is the difference between the bid and ask price, measured in pips. A pip shows how much a price may have moved, while the spread represents the cost of entering a trade and can make a position start slightly “down” when it opens.
What is the difference between fundamental and technical analysis in Forex?
Fundamental analysis looks at economic factors such as interest rates, GDP, inflation, and central bank policy to assess the potential value of a currency over time. Technical analysis looks at past price data, chart patterns, and indicators like RSI and MACD to identify potential trade opportunities. Traders may combine both approaches by using fundamentals to suggest a directional bias and technicals to help time entries and exits.
What are the main Forex trading sessions?
The four main Forex sessions may be Sydney (10 PM to 7 AM UTC), Tokyo (12 AM to 9 AM UTC), London (8 AM to 5 PM UTC), and New York (1 PM to 10 PM UTC). The London session often handles the largest trading volume, and the overlap between London and New York from 1 to 5 PM UTC may produce the most active trading conditions.
Who participates in the Forex market?
The Forex market includes central banks, which are among the most influential participants and may affect exchange rates through monetary policy. Commercial and investment banks handle large volumes of interbank trades. Institutional investors, such as hedge funds and pension funds, may trade large positions for portfolio purposes. Retail traders can access the market through regulated brokers, and liquidity providers supply pricing that may enable tighter spreads and faster trade execution. Platforms like Taurex can allow traders to access a wide range of currency pairs using advanced tools.