
Few data releases carry as much weight on the economic calendar as the Consumer Price Index, or CPI.
On release day, major currency pairs can jump within seconds. Moves of 50 to 100 pips are common when the result is very different from what traders expected. The reason for this is simple. CPI shows how inflation is changing, and this directly affects interest rate expectations. Interest rates are one of the main drivers of currency value.
When inflation changes, traders adjust their expectations about what central banks will do next. This leads to fast shifts in money flows and sharp moves in currencies.
This article covers what CPI in trading means, how the index is calculated, why it matters in Forex, how traders approach CPI releases, and the risks that come with trading one of the most volatile events on the calendar.
What Is CPI in Trading? Understanding the Consumer Price Index
The Consumer Price Index measures the average change over time in the prices consumers pay for a basket of goods and services.
The U.S. Bureau of Labor Statistics states that the CPI measures inflation as experienced by consumers in their everyday expenses. It covers more than 200 categories. These are grouped into eight major areas: food and beverages, housing, apparel, transportation, medical care, recreation, education and communication, and other goods and services.
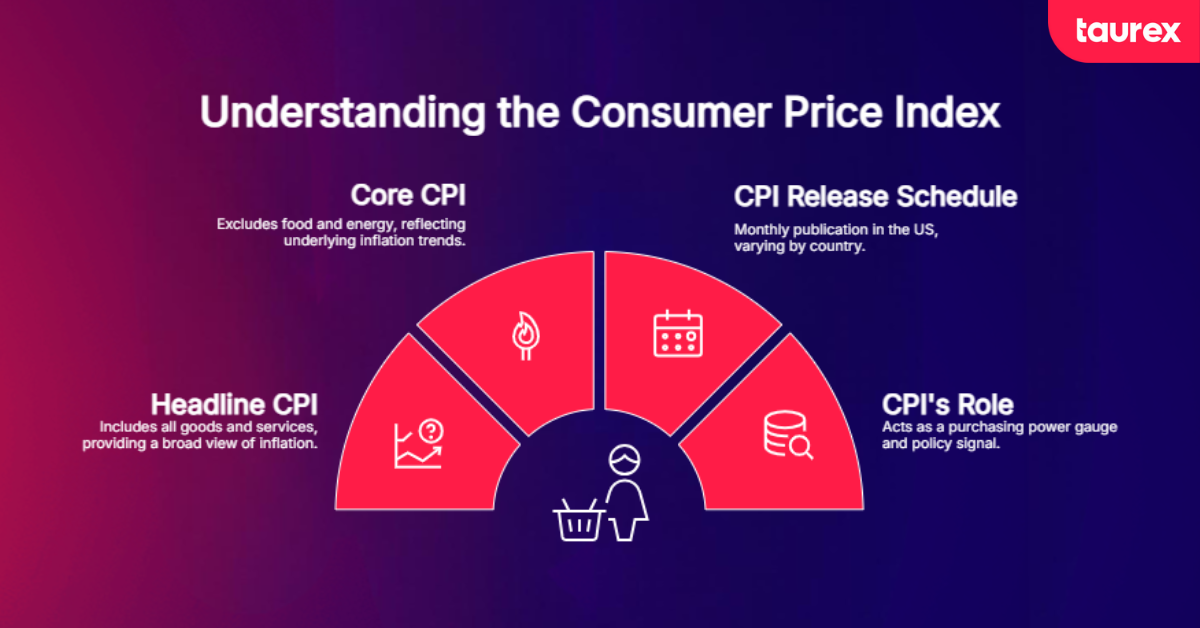
To understand how CPI impacts trading, you should know that the index comes in two main forms, and the difference between them matters for how markets respond:
- Headline CPI includes everything in the basket, including volatile food and energy prices. It gives the broadest picture of price changes but can be influenced by temporary supply shocks in oil or agricultural commodities.
- Core CPI removes food and energy from the calculation. The Core CPI vs Headline CPI distinction is one of the most important separations in CPI Forex analysis: the Core reading tends to be the one central banks and professional traders watch more closely, because it better reflects the underlying inflation trend that monetary policy can actually influence.
In the United States, the Bureau of Labor Statistics (BLS) publishes CPI monthly, typically at 8:30 AM EST on the second Tuesday of the month. The release schedule varies by country: Australia, for instance, reports quarterly, while Germany issues annual figures. Wherever it is published, CPI acts as both a purchasing power gauge for consumers and a policy signal for Forex traders.
Upcoming CPI Release Dates
Knowing the exact release dates in advance lets traders prepare positions, set alerts, and avoid being caught off guard by volatility. The table below shows the next six scheduled U.S. CPI releases, alongside the equivalent dates for the UK and Eurozone. All times are local to each region.
| Data For (Month) | U.S. CPI Release Date | U.S. Release Time | UK CPI Release Date | UK Release Time | Eurozone HICP Flash Estimate | Eurozone Full Release |
| April 2026 | 12 May 2026 | 8:30 AM ET | ~21 May 2026 | 7:00 AM BST | ~30 April 2026 | ~mid-May 2026 |
| May 2026 | 10 June 2026 | 8:30 AM ET | ~18 June 2026 | 7:00 AM BST | ~29 May 2026 | ~mid-June 2026 |
| June 2026 | 14 July 2026 | 8:30 AM ET | ~16 July 2026 | 7:00 AM BST | ~30 June 2026 | ~mid-July 2026 |
| July 2026 | 12 August 2026 | 8:30 AM ET | ~19 August 2026 | 7:00 AM BST | ~31 July 2026 | ~mid-August 2026 |
| August 2026 | 11 September 2026 | 8:30 AM ET | ~17 September 2026 | 7:00 AM BST | ~31 August 2026 | ~mid-September 2026 |
How Is the Consumer Price Index Calculated?
Behind every CPI number is a large data collection process. In the U.S., the Bureau of Labor Statistics tracks around 80,000 prices across many products and locations.
These items are grouped into categories like housing, transport, and food. Each category is given a weight based on how much people spend on it. For example, housing has the biggest weight, so changes in housing prices have a larger impact on CPI than smaller categories like clothing.
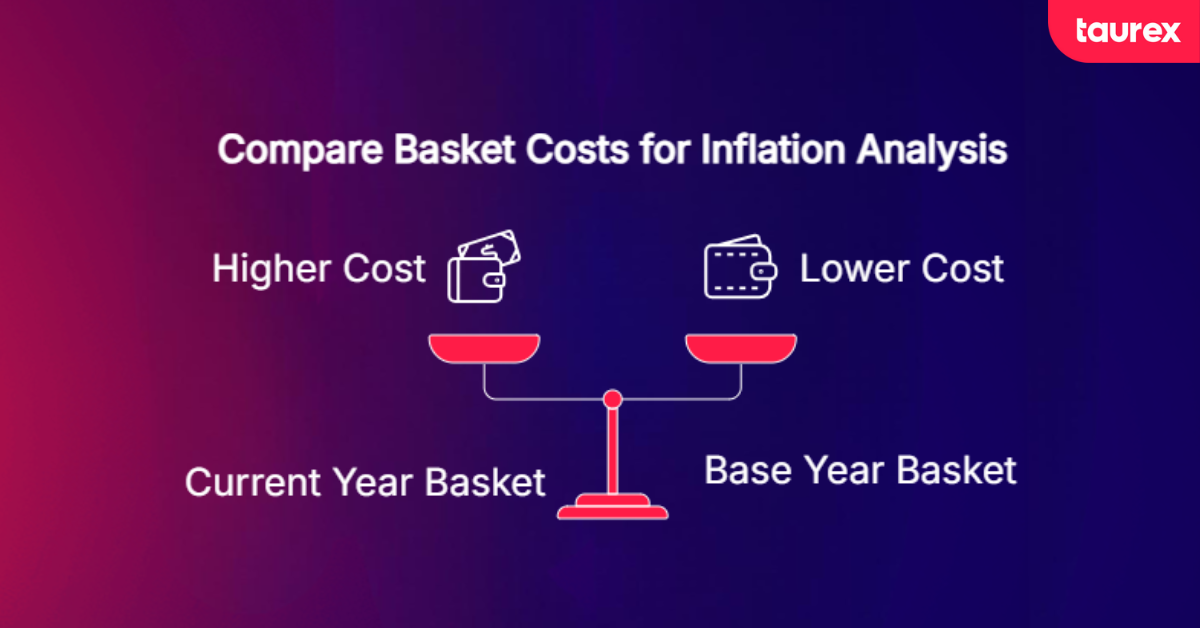
The formula itself is straightforward:
CPI = (Cost of Basket in Current Year / Cost of Basket in Base Year) x 100
The base year is set at 100. If the number is above 100, it means prices have gone up. For example, if a basket of goods costs 500 in the base year and 550 today, the CPI would be 110. This shows that prices have increased by 10%.
The calculation also adjusts for small changes in consumer behavior. If prices rise for certain items, people may switch to cheaper alternatives. CPI takes this into account to give a more realistic view of inflation.
How To Calculate the Inflation Rate From CPI
Once you have two CPI readings, calculating the inflation rate is straightforward:
Inflation Rate = [(CPI New Period – CPI Previous Period) / CPI Previous Period] x 100
As a real-world example, if CPI stood at 44.4 in 1973 and rose to 49.3 in 1974, the inflation rate for that year was approximately 11%.
Forex traders tend to focus on both year-over-year (YoY) and month-over-month (MoM) comparisons. YoY shows the broader trend, while MoM offers a more current signal on whether inflation is accelerating or cooling.
It was precisely this kind of inflation rate calculation that underpinned the Fed’s aggressive rate hike cycle, which saw rates climb from 0.1% to 5.25% between December 2021 and August 2023. Following three rate cuts in the second half of 2025, the Fed has since eased to a target range of 3.50%–3.75%, where it has held steady through early 2026 as inflation remains above its 2% goal.
Why Is CPI Important in Forex?
CPI in Forex trading is a direct input into central bank monetary policy decisions, making it one of the most closely monitored indicators on the market.
The mechanism works like this: higher CPI readings build expectations for interest rate hikes, which tend to strengthen the relevant currency as capital moves toward higher-yielding assets. Lower CPI readings have the opposite effect, supporting rate cut expectations and weakening the currency.
Since the USD is the world’s most traded currency and sits on one side of the majority of Forex pairs, U.S. CPI data carries the broadest global reach, directly affecting pairs like EUR/USD, USD/JPY, and GBP/USD.
What really moves the market is not just the CPI number, but how it compares to expectations. If CPI is higher than expected, the dollar can rise quickly. If it is lower, the dollar may fall.
Central banks also pay close attention to Core CPI, which removes food and energy prices. This gives a clearer view of long-term inflation and is important for traders to watch.
CPI is not only important for trading. It is also used to adjust wages, taxes, and government payments. This is why the release can affect both the economy and the markets at the same time.
How to Trade CPI: Strategies for CPI Data Releases
Preparation begins well before the data is published. Check your economic calendar ahead of the release: CPI is classified as a high-impact event. Monitor analyst consensus forecasts carefully, because the market reaction is tied largely to the gap between what was expected and what actually comes in.
A deviation of 0.2% or more from consensus may create enough momentum for a sustained directional move, while a 0.1% deviation more often results in a whipsaw, where price spikes and then quickly reverses. Identifying key support and resistance levels on your charts ahead of time gives you reference points for where the market may stall or accelerate.
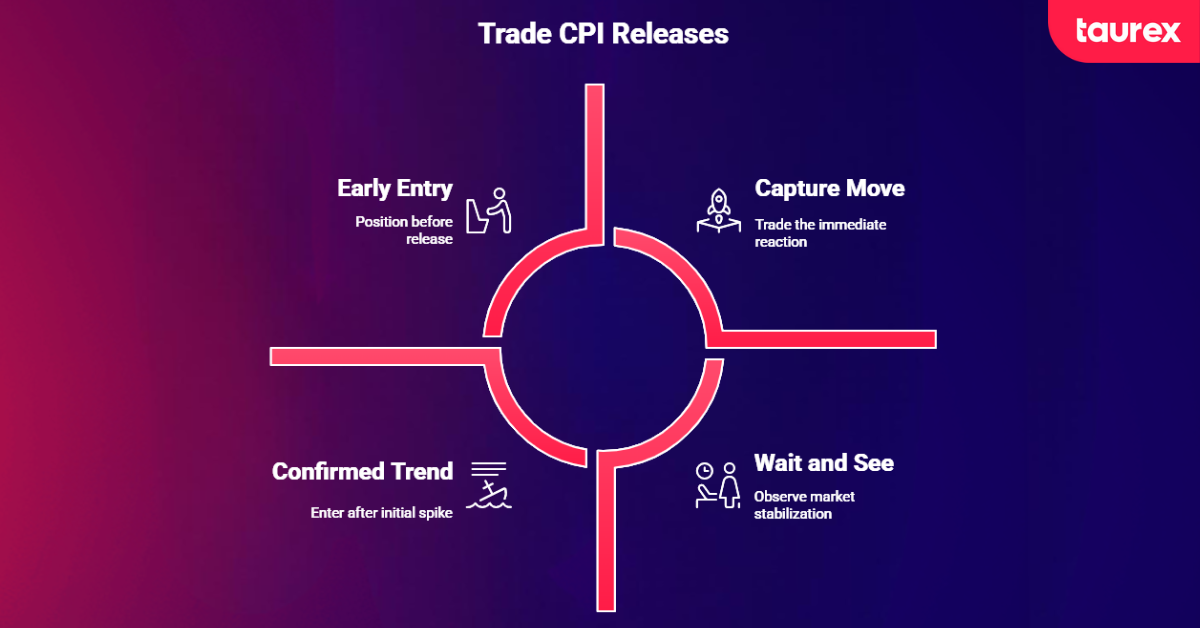
Several CPI trading strategy approaches are commonly used:
- Pre-CPI positioning involves taking a directional view before the release based on prior inflation trends and forecasts. This carries a higher risk but may deliver an early entry advantage if the analysis proves correct.
- Post-CPI news trading means entering after the release once the initial spike settles, giving a clearer read on direction with less noise.
- The Second Wave approach is based on the observation that in the first 0 to 60 seconds, bank algorithms pull their limit orders to avoid being caught on the wrong side, creating a liquidity gap. Between minutes 1 and 10, the price attempts to find the fair value. Around the 15-minute mark, the true institutional trend tends to begin as spreads normalize.
- The straddle strategy involves placing both buy and sell orders around the current price just before the release, aiming to capture the large move in whichever direction it goes.
- Breakout trading focuses on watching key levels and entering when the price breaks through with momentum after the release.
- Trend following uses indicators like RSI, Bollinger Bands, or moving averages to confirm whether a CPI-driven move has enough strength to sustain, which ties well into broader fundamental analysis methods.
One thing to keep in mind: pay attention to the gap between Headline CPI and Core CPI. If they diverge significantly, the initial move may not hold, as traders reassess which reading carries more weight for policy.
How CPI Reports Impact the Forex Market
CPI releases are among the most volatile events on the Forex calendar. Options traders, for instance, were pricing in an average 38-pip move in EUR/USD and a 58-pip move in USD/JPY ahead of a single 2024 CPI release. Major pairs react directly to U.S. CPI, and commodity-linked currencies such as AUD/USD and USD/CAD often follow.
The general pattern tends to play out like this:
- Hot CPI (above forecast): USD may strengthen, EUR/USD and GBP/USD may decline, risk currencies and gold may weaken, and rate hike expectations may accelerate.
- Soft CPI (below forecast): USD may weaken, EUR/USD and GBP/USD may rise, gold and risk assets may benefit, and rate cut expectations may grow.
In October 2024, Core CPI unexpectedly widened to 3.3% with the shelter index rising 4.9% YoY, causing EUR/USD to bounce from 1.0900 back to 1.0937 in an immediate reaction. In 2022, as U.S. CPI surged while Japan’s remained subdued, USD/JPY appreciated significantly from March to November, driven by the stark policy difference between the Federal Reserve and the Bank of Japan.
There is also the “priced in” dynamic to consider. If markets have been buying USD in anticipation of a hot CPI reading for 48 hours before the release, the actual print, even if it meets or slightly beats expectations, can trigger a “sell the fact” reversal that may catch directional traders off guard.
What to Look for Inside the CPI Report
The main CPI and Core CPI numbers usually move first, but the details inside the report often decide whether the market move continues or quickly reverses. Professional traders pay close attention to a few key parts of the data.
- Shelter (housing costs) is the largest part of the CPI basket, making up about 36 percent. It tends to move slowly because rent data is updated with a delay as leases renew over time. This means shelter inflation can stay high even when other prices are falling. When the shelter starts to cool, traders may expect inflation pressure to ease and rate cuts to come sooner. For example, in October 2024, shelter inflation at 4.9 percent year over year kept core inflation elevated even though other prices were easing.
- Services excluding shelter (supercore) are closely watched by the Federal Reserve. It reflects domestic demand and wage pressure more than global factors like energy or goods prices. If this part of the report is high, it can signal strong underlying inflation, which may support a “higher for longer” interest rate outlook and strengthen the USD.
- Used vehicles and core goods are usually the most volatile parts of the report. They can move sharply month to month and often reflect temporary factors like supply chain changes. For example, used car prices helped push inflation higher in 2021 and 2022, then fell in 2023 and helped bring inflation down faster than expected. Because these changes are often temporary, traders usually give them less weight when thinking about long-term currency direction.
A simple way to approach the report is to compare the forecast with the actual number, then check which category caused the surprise. If the surprise comes from shelter, it is more likely to influence interest rate expectations and have a longer-lasting impact on currency moves.
Average Pip Movement: CPI Days vs. Normal Days
The 38-pip EUR/USD and 58-pip USD/JPY figures quoted above reflect option market pricing for a single release, but they illustrate a broader pattern: CPI days consistently produce elevated ranges compared with routine trading sessions. The table below summarises historical average daily pip ranges for major pairs on U.S. CPI release days versus non-event days, based on data from high-impact releases between 2022 and 2024 — a period that included both the peak inflation cycle and the subsequent disinflation phase.
| Currency Pair | Avg. Daily Range (Non-CPI Day) | Avg. Daily Range (U.S. CPI Day) | Approximate Multiplier |
| EUR/USD | ~55 pips | ~105 pips | ~1.9× |
| GBP/USD | ~60 pips | ~115 pips | ~1.9× |
| USD/JPY | ~60 pips | ~130 pips | ~2.2× |
| USD/CAD | ~50 pips | ~90 pips | ~1.8× |
| AUD/USD | ~45 pips | ~80 pips | ~1.8× |
| XAU/USD (Gold) | ~$15 | ~$30 | ~2.0× |
Global Inflation Trends and Their Impact on Forex
Inflation is not just a U.S. story. Every major economy is at a different stage of its inflation cycle, and these differences are what drive many Forex opportunities. Central banks respond to their own CPI data by adjusting interest rates. When inflation rises, rates often go up, which can strengthen a currency. When inflation falls, rates may be cut, which can weaken it.
In recent years, central banks have taken different paths. The U.S. raised rates aggressively and held them at elevated levels before beginning to cut in late 2025, while the Eurozone moved toward rate cuts earlier as inflation eased more quickly. The UK followed a mixed path, and Japan remained an outlier with very low rates.
This gap between countries is known as inflation divergence, and it is one of the main drivers of currency movements. For example, when the U.S. raised rates while Japan held steady, USD/JPY moved sharply higher.
CPI releases are key moments for traders. Each report can trigger fast price movements, especially when the data differs from expectations. U.S. CPI affects all USD pairs, while UK and Eurozone data mainly impact their own currencies.
Traders should focus not only on the headline number but also on the surprise factor and underlying details. Comparing CPI trends across countries helps traders anticipate which central bank may act next and where currency pairs may move over time.
How to Read CPI Alongside PPI and PCE
Experienced traders do not look at CPI on its own. Two other inflation measures help give a clearer picture.
The Producer Price Index (PPI) looks at inflation earlier in the supply chain, before products reach consumers. It measures price changes at the wholesale level. If PPI is rising, it often means higher costs may reach consumers later, which can push CPI higher in the future.
When both PPI and CPI are rising together, it may suggest stronger inflation pressure and a higher chance of interest rate hikes. If PPI starts to fall while CPI is still high, it can mean inflation may ease in the coming months.
The Personal Consumption Expenditures (PCE) Price Index is the Federal Reserve’s preferred inflation measure. It is similar to CPI but uses a different method. It gives more weight to healthcare and adjusts more easily when people change what they buy. The Fed focuses on Core PCE, which removes food and energy prices, when aiming for its 2 percent inflation target. Because of this, a CPI surprise may not have a lasting effect on the market if PCE tells a different story.
In simple terms, CPI often triggers the first market reaction, PPI can hint at where inflation is heading next, and PCE is the key measure the Federal Reserve relies on most.
Risks and Challenges of Trading CPI Reports
CPI is one of the highest impact events a Forex trader will face, and it carries proportional risks.
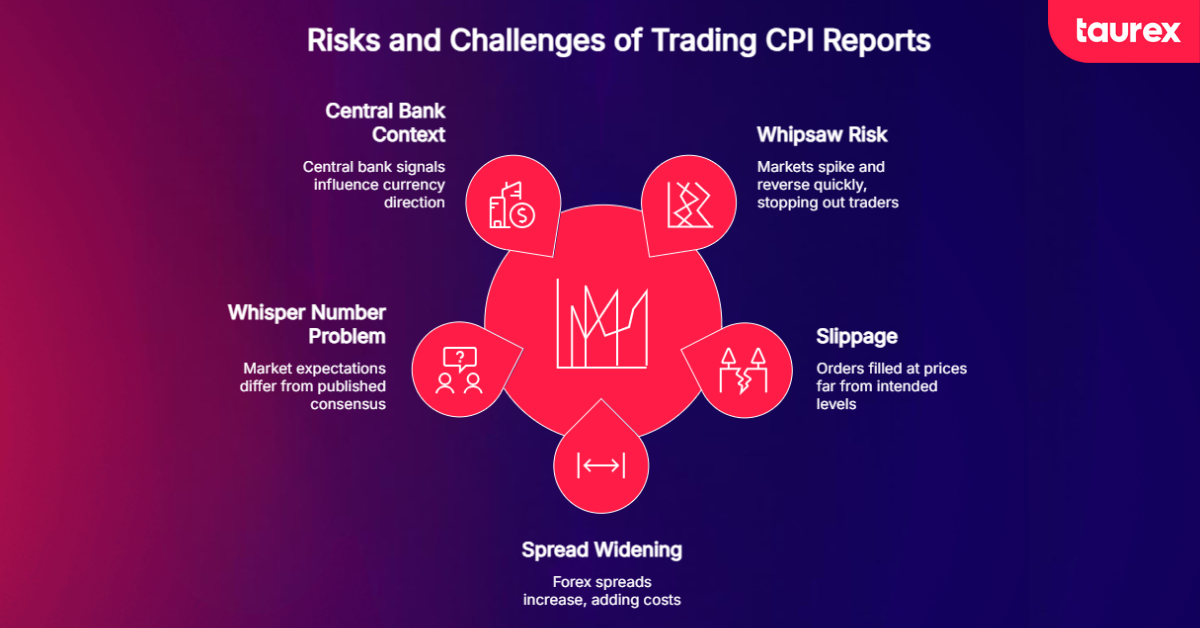
- Whipsaw risk is the most common concern. Markets may spike sharply in one direction during the first 60 seconds, then reverse just as quickly, stopping out traders who chased the initial move. A 0.1% deviation from consensus is often enough to create this kind of choppy, directionless price action.
- Slippage becomes a real concern during CPI releases. Bank algorithms pull their limit orders immediately after the number is published, creating liquidity gaps where orders may get filled at prices far from intended levels. Wider stop-losses and smaller position sizes can help manage this.
- Spread widening adds another layer of cost. Forex spreads on major pairs can spike in the seconds before and after a CPI print, increasing both entry and exit costs. This is something to factor into your risk-to-reward calculation before placing any order.
- The “Whisper Number” problem may catch traders by surprise. Sometimes CPI beats the published consensus forecast, yet the USD sells off because institutional desks had been positioning for an even higher number. If the market spent 48 hours buying USD in anticipation, the move was already priced in, and even a strong print may trigger a “sell the fact” reaction.
- Central bank context also matters. A high CPI number does not always strengthen a currency if the central bank has already signaled it will look past near-term inflation spikes. There are periods where CPI and the U.S. Dollar Index diverge, suggesting other forces are driving currency direction.
For those still developing their trading approach, observing CPI behavior in a demo environment first is a prudent step. Trading smaller than normal, always using a stop-loss, and avoiding the first 60 seconds of a release are practical steps that may help manage volatility without taking on disproportionate risk. When trading high-impact events, choosing a broker with reliable execution matters.
A broker like Taurex offers fast execution, tight spreads, and stable trading conditions during volatile events like CPI, helping traders manage risk more effectively when market conditions become unpredictable. You can practice these strategies safely by opening a demo account with Taurex and testing your trades in real market conditions without risking real money.
FAQ
How does the consumer price index affect Forex?
CPI shows how fast prices are rising. Central banks use it to decide interest rates. If CPI is higher than expected, traders may expect rate hikes. This can make the currency stronger. If CPI is lower, traders may expect rate cuts, which can weaken the currency. The biggest moves happen when the result is very different from what the market expected.
How often are CPI reports released?
In the United States, CPI is released once a month, usually on the second Tuesday at 8:30 AM Eastern Time. Other countries have different schedules. The UK and Eurozone also report monthly, while Australia reports quarterly. Traders track these dates in advance because CPI is one of the most important market events.
Does CPI affect all Forex pairs equally?
No, the impact is not the same for all pairs. U.S. CPI affects the most pairs because the dollar is widely used in global trading. This means pairs like EUR/USD, USD/JPY, and GBP/USD often react strongly. CPI from other regions mostly affects their own currencies. For example, UK CPI moves GBP pairs, and Eurozone CPI moves EUR pairs.
Is a lower or higher CPI figure good for markets?
It depends on the situation. Higher CPI can strengthen a currency because it may lead to higher interest rates. But it can also put pressure on stocks and risk assets. Lower CPI can support stocks because it may lead to lower rates, but it can weaken the currency. What matters most is how the number compares to expectations.
What is CPI used for?
CPI is used in many ways. Governments and central banks use it to set interest rates and adjust things like wages, pensions, and taxes. For traders, CPI helps show the direction of inflation. It also helps them understand where currencies, stocks, and other markets may move next.

