



Not every bullish setup starts with prices moving higher. The falling wedge pattern forms during a decline, but beneath the surface, selling momentum is gradually weakening as price compresses into a narrowing range.
Widely used in technical analysis, the Forex falling wedge pattern can signal a potential bullish reversal or continuation.
In this guide, you’ll learn how to identify a valid setup, confirm the breakout, and apply a falling wedge trading strategy using the charting tools on your forex trading platform.
What Is a Falling Wedge Pattern in Forex Trading?
A falling wedge pattern is a formation built from two downward-sloping trendlines that converge as the chart moves to the right. Price keeps printing lower highs and lower lows, but the swings get progressively smaller. This signals that sellers are running out of steam while buyers quietly accumulate.

It can act as both a bullish reversal pattern after a downtrend and a continuation pattern within an existing uptrend. Either way, the descending wedge pattern resolves to the upside, which is why traders treat it as a bullish signal across all currency pairs and timeframes.
How a Falling Wedge Pattern Forms in Forex
The psychology here is easy to picture once you understand it. Sellers are still in control, pushing prices down, but each push lands with less force than the one before.
For example, we have a basketball bouncing on the floor. Every bounce is shorter than the last until the ball finally settles. On the chart, that fading momentum shows up as two descending trendlines slowly squeezing toward each other.
Volume usually contracts as the descending wedge pattern develops, which is a sign of consolidation rather than genuine continuation. On a daily chart, the structure often takes three to six months to fully mature, though it can form much faster on intraday charts. The longer it coils, the more meaningful the eventual breakout tends to be.
How to Identify a Valid Falling Wedge Pattern
Not every cluster of lower highs and lows qualifies as a falling wedge. Treat identification as a checklist rather than a glance.
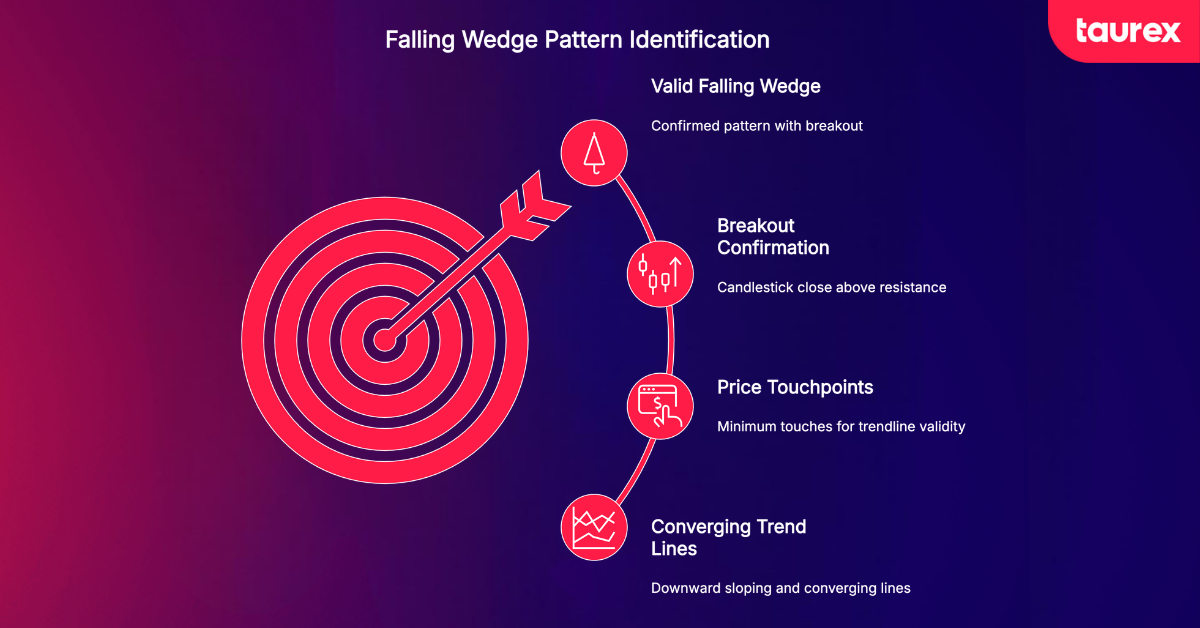
- Converging Trendlines. Both trendlines must slope downward and converge toward each other, with the upper resistance line descending faster than the lower support line. If the two lines run parallel, you are looking at a channel, not a wedge, and the trading logic is entirely different.
- Multiple Price Touchpoints. Each trendline needs a minimum of two touches, and three or more is far better for reliability. We can suggest around five contact points across both lines before a pattern is fully valid. More touches mean more traders are watching the same levels.
- Breakout Direction and Confirmation. A genuine falling wedge breaks to the upside. The confirmation signal is a full candlestick close above the upper trendline, ideally on higher-than-average volume. Waiting for that close is what separates a confirmed signal from a hopeful guess.
- Common Signs of an Invalid Pattern. Be wary of fewer than two touches per line, nearly parallel boundaries, price breaking to the downside, or a breakout on thin volume with no follow-through. Patterns that form in a very short window are also less reliable.
Falling Wedge Pattern Trading Strategy: Step-by-Step Setup
A repeatable process is what separates disciplined traders from reactive ones. Here is how to trade falling wedge pattern setups in sequence.
- Identify the Wedge Formation. Scan for two converging, downward-sloping trendlines on a 4-hour or daily forex trading chart. Confirm at least two to three touches on each line and a clear narrowing of the price range over time.
- Mark Key Resistance Levels. Before placing anything, note the prior swing highs and resistance zones sitting above the wedge. These become your profit target areas once the price breaks free.
- Wait for Breakout Confirmation. Resist the urge to enter while the price is still inside the wedge. Wait for a full candle close above the upper trendline, and let rising volume on that candle strengthen the case.
- Plan the Entry. Aggressive traders enter on the breakout candle close. More conservative traders wait for the price to retest the broken trendline as new support and confirm it holds before going long.
- Set Risk Parameters Before Entering. Place your stop-loss below the most recent swing low inside the wedge and aim for a minimum 1:2 risk-to-reward ratio. Never enter without a defined stop in place.
Three Ways to Trade a Falling Wedge Breakout
Before choosing an entry, it is worth deciding how much confirmation you want from the market. Some traders prioritise getting in early, while others prefer to wait for additional evidence that the breakout is likely to hold.
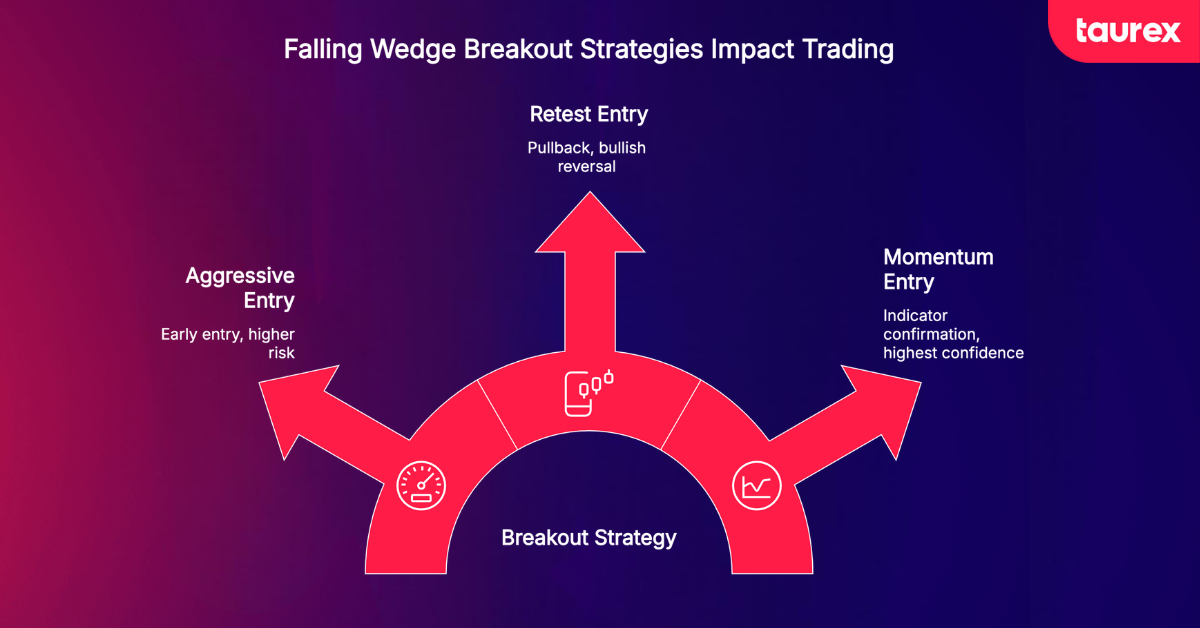
Aggressive Breakout Entry
Enter the moment a candle closes above the upper resistance trendline. This captures most of the move but accepts a higher chance of being caught in a false breakout. It works best when volume confirms strongly at the break. It is worth noting that this approach shares similarities with opening range breakout logic, where speed of entry is prioritised over confirmation.
Retest Entry Strategy
After the breakout, wait for the price to pull back and test the former resistance line as new support. Enter on a bullish reversal candle at that level. The payoff is a tighter stop, a cleaner risk-to-reward ratio, and a lower chance of a false entry. This retest can sometimes coincide with a price gap if the breakout occurs between sessions, adding further significance to the support level.
Momentum Confirmation Entry
Here you wait for the breakout plus a confirming indicator signal, such as a MACD bullish crossover, RSI crossing above 50, or a close above a key moving average. It is the slowest entry of the three, but it carries the highest confidence. Traders who use divergence signals often fold this step into their routine naturally.
How to Set Profit Targets for Falling Wedge Trades
Once a breakout is confirmed, the next step is determining where to take profits. Rather than relying on guesswork, traders often use a combination of chart structure and technical tools to identify potential target areas.
- Measuring the height of the pattern: Measure the widest vertical distance of the wedge, from the top of the pattern to the first major low, then project that distance upward from the breakout point. This provides a minimum measured move and a logical initial target.
- Using previous resistance zones: Prior swing highs often act as potential resistance levels after a breakout. These areas can serve as reference points for scaling out of positions or taking partial profits.
- Combining Fibonacci retracement with the pattern: Apply a Fibonacci retracement tool from the wedge’s swing low to its swing high. The 161.8% and 261.8% extension levels are commonly used as potential targets beyond the standard measured move.
- Scaling out of winning positions: Some traders choose to take partial profits at an initial target, adjust their stop-loss toward breakeven, and leave a portion of the position open to participate in a larger move if momentum continues.
Falling Wedge Pattern vs Other Bullish Forex Patterns
The falling wedge can resemble other bullish chart patterns, but its structure and market context are different. Unlike a bull flag, which uses roughly parallel trendlines after a sharp rally, a falling wedge forms between two downward-sloping converging lines and may signal either a reversal or continuation.
An ascending triangle has flat resistance and rising support, while an inverse head and shoulders forms through three distinct troughs and a neckline. The table below summarises the main differences.
| Pattern | Trendlines | Context | Breakout Direction | Formation Time |
| Falling Wedge | Both sloping down, converging | Downtrend reversal/uptrend continuation | Upward | Weeks to months |
| Bull Flag | Parallel, slight downward slope | Continuation after rally | Upward | Days to weeks |
| Ascending Triangle | Flat top, rising bottom | Continuation in uptrend | Upward | Weeks to months |
| Inverse Head & Shoulders | Three troughs + neckline | Downtrend reversal | Upward | Weeks to months |
Advantages and Limitations of the Falling Wedge Pattern
The falling wedge provides clear structural levels for identifying breakouts, planning entries, and managing risk. However, the pattern remains subjective and can produce false signals, especially without confirmation from broader market conditions.
| Advantages | Limitations |
| Clear converging trendlines make the pattern relatively easy to recognise. | Trendline placement can vary between traders. |
| The breakout level provides a defined entry reference. | Price may briefly break resistance before returning inside the wedge. |
| Recent swing lows can guide stop-loss placement. | Stops may be wide when the pattern covers a large price range. |
| The wedge height can provide a measured-move target. | Projected targets are estimates and may not be reached. |
| Can act as a bullish reversal or continuation pattern. | The broader trend and market context can affect the outcome. |
| Can be combined with RSI, MACD, and support and resistance. | Spot forex volume is platform-specific, so volume confirmation has limitations. |
Common Mistakes Traders Make With Falling Wedges
Even a textbook pattern can fail when execution is sloppy. These are the errors that quietly drain accounts.

- Entering Before the Breakout. The bullish bias is only confirmed once the price closes above the upper trendline. Jumping in early on anticipation leaves you fully exposed if the pattern breaks down instead.
- Trading Weak or Poorly Defined Patterns. Setups with fewer than two touches per line, near-parallel boundaries, or a very short formation window carry far lower odds. Quality always beats quantity when hunting for these setups.
- Ignoring Higher-Time-Frame Market Structure. A falling wedge on a 1-hour chart fighting against a strong daily downtrend is a low-probability trade. Always check that the pattern aligns with the higher-timeframe bias before committing.
- Setting Unrealistic Profit Targets. Reaching for levels far beyond the measured move and nearby resistance usually means handing back gains you already had. Stick to measured targets and scale out methodically.
- Letting Losses Compound After a Failed Breakout. When a setup does not work out, accept it and move on. Doubling down or immediately re-entering in the hope of recovering is a form of revenge trading that tends to create larger losses than the original trade.
- Ignoring Trading Costs. Wider Forex spreads can eat meaningfully into a trade’s risk-to-reward ratio, particularly on shorter timeframes. Factor spreads into your calculations before entering, not after.
- Letting Drawdown Get Out of Hand. Even a high success rate of a falling wedge pattern does not protect you from a bad run. Keeping your position size consistent and understanding Forex drawdown helps you stay in the game through losing periods.
Final Thoughts
The falling wedge is a widely used bullish chart pattern that offers clearly defined entry, stop-loss, and profit target levels. As with any technical setup, patience is key, as waiting for a confirmed breakout can help filter out weaker signals and reduce the risk of false entries.
With Taurex, you can analyse and trade falling wedge patterns on MetaTrader 4 and MetaTrader 5, using advanced charting tools, fast execution, and built-in risk management features to support your trading process. A demo account also provides an opportunity to practise identifying setups and testing strategies in live market conditions without risking capital.
Ready to put the falling wedge trading strategy into practice? Open a demo account to practise identifying falling wedge setups and testing breakout entries before trading live.
FAQ
What is a falling wedge pattern in Forex?
A falling wedge pattern in Forex is a bullish chart pattern formed by two downward-sloping trendlines that converge over time. Price makes lower highs and lower lows, but the trading range gradually narrows, suggesting that selling pressure may be weakening. A breakout above the upper trendline can signal a potential bullish reversal or continuation.
Is a falling wedge pattern always bullish?
A falling wedge is generally considered a bullish pattern because it typically resolves with an upside breakout. Whether it acts as a reversal or a continuation pattern depends on the broader market trend and where the pattern forms.
How do you confirm a falling wedge breakout?
A breakout is commonly confirmed when a candle closes above the upper resistance trendline. Some traders also look for supporting signals such as increased volume, a MACD bullish crossover, RSI moving above 50, or bullish candlestick formations near the breakout point.
What is the best timeframe for trading falling wedges?
The 4-hour and daily charts are commonly used because they tend to provide clearer pattern structures and fewer false signals than lower timeframes. Falling wedges can also appear on shorter charts, although signal reliability may vary.
How do you calculate a falling wedge target?
Measure the widest vertical distance between the upper and lower trendlines at the start of the pattern, then project that distance upward from the breakout point. Some traders also use Fibonacci extension levels, such as 161.8% and 261.8%, to identify additional target zones.
What is the difference between a falling wedge and a descending channel?
A descending channel is formed by parallel trendlines that maintain a relatively consistent distance apart. A falling wedge has converging trendlines, meaning the distance between support and resistance narrows over time. Falling wedges are typically associated with breakout opportunities, while descending channels often reflect an ongoing trend.
Can a falling wedge appear in an uptrend?
Yes. When a falling wedge develops during an existing uptrend, it is often interpreted as a continuation pattern that represents a temporary pullback before the broader trend resumes.
What indicators work best with a falling wedge pattern?
RSI, MACD, volume, and moving averages are commonly used alongside falling wedge patterns. Traders often look for bullish divergence on RSI, bullish MACD crossovers, increased volume on the breakout, and alignment with key moving averages for additional confirmation.
How can beginners trade falling wedge patterns?
Beginners may benefit from practising pattern recognition on a demo account before trading live. Many traders focus on higher timeframes such as the daily or 4-hour chart, wait for a confirmed breakout above resistance, and use predefined stop-loss and risk management rules to manage exposure.



