
Imagine you’ve been trading Forex for a few weeks and things are going well. Your account climbs from $10,000 to $11,500, then a rough patch hits, and a string of losing trades drags your balance down to $8,500. You stare at the screen, wondering whether your strategy is broken, whether you should close everything, or whether this is just part of the process.
That drop from $11,500 to $8,500 has a name: it’s called a drawdown. How you respond to it will say more about your long-term survival as a trader than any single winning trade ever could. Understanding drawdown in trading is one of the most important skills a forex trader can develop.
This guide covers what drawdowns are, why they matter, the different types you’ll come across, and the steps traders use to keep them under control.
What Is a Drawdown in Trading? Definition and Calculation
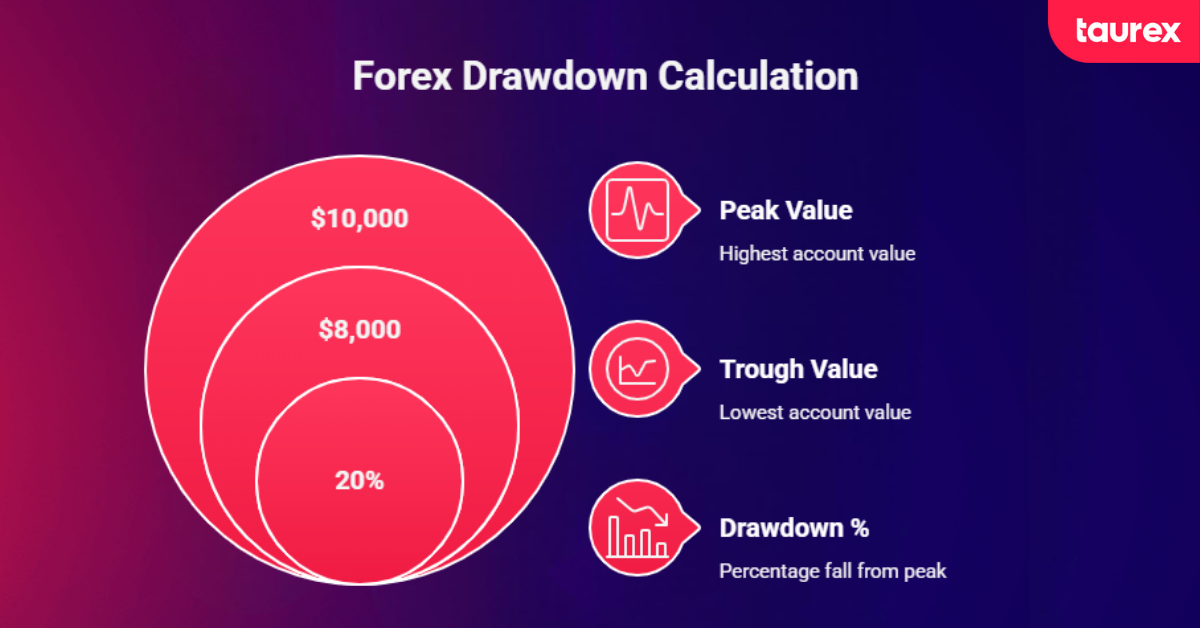
A drawdown in trading measures the percentage fall from the highest point your account has reached to its lowest point before it starts to recover. Think of it as the distance between the top of a hill and the bottom of the valley before the path starts climbing again.
The formula is straightforward:
Drawdown % = (Peak Value – Trough Value) / Peak Value x 100
So if your account reaches $10,000 and then falls to $8,000, the drawdown is ($10,000 – $8,000) / $10,000 x 100 = 20%.
One thing that catches people out early on is the difference between a drawdown and your personal loss on a trade. They’re not the same thing. Say you buy EUR/USD at 1.1000. The price climbs to 1.2000 (the peak), then slides to 1.0000 (the trough). The drawdown from peak to trough is (1.2000 – 1.0000) / 1.2000 = 16.67%. But because you entered at 1.1000, your floating loss at 1.0000 is measured from your entry point, which is a completely different number from the drawdown percentage itself.
Every drawdown moves through four stages: the peak (the high point), the trough (the low), the recovery (climbing back to the previous high), and the expansion (pushing beyond it into new highs).
Why Are Drawdowns So Important in Trading?
Here’s the part that catches most traders off guard: recovering from a drawdown is not a simple process. The maths work against you in a way that gets worse the deeper you fall.
| Drawdown | Gain Required to Break Even |
| 5% | ~5.26% |
| 10% | ~11.1% |
| 20% | 25% |
| 40% | ~67% |
| 50% | 100% |
| 90% | 1,000% |
A 5% drawdown only requires about a 5.26% gain to recover. But a 40% drawdown demands a 67% gain just to get back to where you started. At 50%, you need to double your remaining capital. This is the single most important reason why professional traders focus so much on risk management rather than chasing big returns.
Beyond the numbers, drawdowns carry a psychological weight that can make the financial damage worse. Long losing periods trigger stress, lead to impulsive decisions, and can cause traders to abandon a sound strategy at the worst possible moment, often just before a recovery.
A strategy that returns 30% per year sounds good until you learn it went through a 60% drawdown along the way. The return tells you what you gained; the drawdown tells you what you had to go through to get there.
Drawdowns are also how fund managers and strategy developers measure performance. At Taurex, traders have access to real-time account monitoring tools so they can track drawdown levels as they develop, rather than discovering a problem after it’s already too late to act.
What are the Types of Drawdowns and Their Implications?
Not all drawdowns in Forex are measured the same way. If you’re reading broker reports, backtesting results, or prop firm rules, you need to know which type they’re referring to, because the differences change how you read risk and set your trading rules.
What Is Maximum Drawdown and How Bad Can It Get?
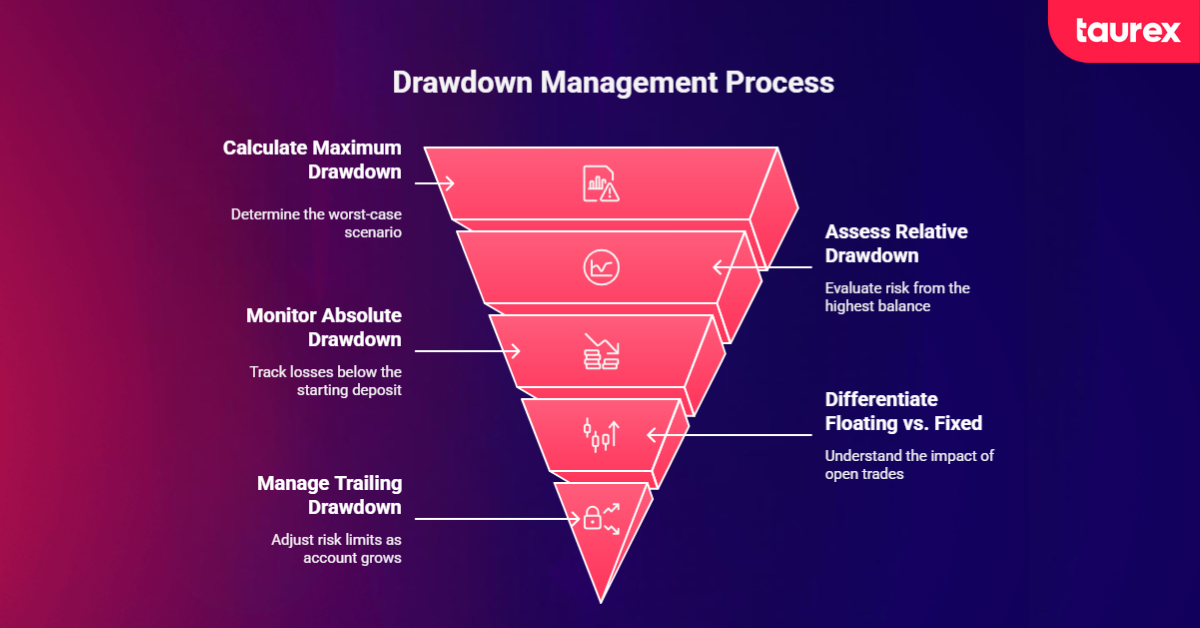
What is maximum drawdown? It’s the single largest peak-to-trough fall your account has ever had over a given period. It answers one question: what’s the worst-case scenario for this strategy?
Knowing how to calculate drawdown is straightforward once you have the formula. The formula is the same as the standard drawdown calculation, but applied to the biggest fall across the full trading history:
Maximum Drawdown = (Highest Peak – Lowest Trough) / Highest Peak x 100
Hedge funds and institutional traders typically aim for a maximum drawdown between 1% and 5%, while retail traders often consider anything under 20% as acceptable. Once the maximum drawdown goes past 50%, recovery becomes very difficult without an exceptional run of winning trades.
A high maximum drawdown doesn’t automatically mean a strategy is bad, but it does mean the returns need to be high enough to justify that level of risk. This is where the Calmar Ratio, covered below, becomes useful.
Relative Drawdown: How Much of Your Account Is Really at Risk?
Relative drawdown measures the percentage fall from the highest balance your account has ever reached, not from your starting deposit. This is the number most broker dashboards and technical analysis platforms show you.
Relative Drawdown = (Equity Peak – Lowest Equity) / Equity Peak x 100
For example, your account peaks at $12,000 and then drops to $9,000. The relative drawdown is ($12,000 – $9,000) / $12,000 x 100 = 25%.
Relative drawdown is sometimes called the “critical stop-loss.” When a trader’s relative drawdown reaches a level they set in advance, it’s often the signal to close all positions and take a fresh look at the whole approach.
Absolute Drawdown: The Baseline Loss You Can’t Ignore
Absolute drawdown looks at how far your account has ever fallen below your starting deposit. Unlike relative drawdown, it ignores any profits you made before the drop. It only asks one question: has this strategy ever put you in the red compared to where you started?
Absolute Drawdown = Initial Deposit – Minimum Equity (if below the initial deposit)
If you deposit $5,000 and the account drops to $4,200 at its lowest point, the absolute drawdown is $800, or 16%. A common guideline is to keep absolute drawdown under 10% of your starting funds, because once you fall below your starting capital, the pressure to take bigger risks to catch up can grow quickly.
Key Differences Between Floating and Fixed Drawdowns
This is something many newer traders overlook, but it has real consequences for how you manage open positions.
A floating drawdown refers to losses on positions that are still open. Your account shows a lower balance on screen, but nothing has been locked in yet because the trade could still reverse and recover.
A fixed drawdown is a loss you’ve already locked in by closing the trade. The capital is gone from the account.
Here’s where emotional control matters. Say you go long on GBP/USD and the position moves 200 pips against you. If the trade is still open, that’s a floating drawdown. If you panic and close it, the loss becomes fixed. The shift from floating to fixed drawdown often comes down to psychological control rather than market conditions.
Trailing Drawdown: Why Your Risk Limit Isn’t Fixed
If you’re involved in prop firm challenges, trailing drawdown is something you’ll come across often. It’s a loss threshold that moves upward as your account grows, but never moves back down.
Here’s how it works in practice. You start a $10,000 challenge with a 10% trailing drawdown, so your floor is $9,000. You make $500, pushing the balance to $10,500, and the floor moves up to $9,500. Make another $500, and the floor sits at $10,000. If your account ever drops below the floor, the challenge ends, even if you’re still ahead of where you started.
This is why many traders fail prop challenges even while being profitable overall. There are two versions to know: End-of-Day trailing drawdown recalculates the floor once at market close, so intraday pullbacks don’t count. Intraday trailing drawdown adjusts in real time, meaning even a brief spike against you could end the challenge. End-of-Day is generally seen as far more trader-friendly.
Calmar Ratio: Is Your Return Worth the Risk?
The Calmar Ratio is a way of measuring whether your returns are worth the drawdown risk you’re taking. It divides your annualised return by your maximum drawdown and was created by Terry W. Young in 1991.
Calmar Ratio = Annualised Return / Maximum Drawdown
A ratio below 1 means your returns don’t justify the drawdown risk. Between 1 and 2 is acceptable. Above 3 is very good, and rare over multi-year periods.
Here’s a simple comparison. Strategy A earns 15% per year with a 5% maximum drawdown, giving it a Calmar of 3.0. Strategy B earns 20% but had a 40% maximum drawdown, giving it a Calmar of 0.5. Strategy B has higher raw returns, but Strategy A is the far better performer when you take risk into account. When looking at any strategy or signal provider, the Calmar Ratio is one of the most useful tools you can use.
What Are the Risks of Drawdown in Forex Trading?
The recovery maths covered earlier is the most obvious risk, but it’s far from the only one.
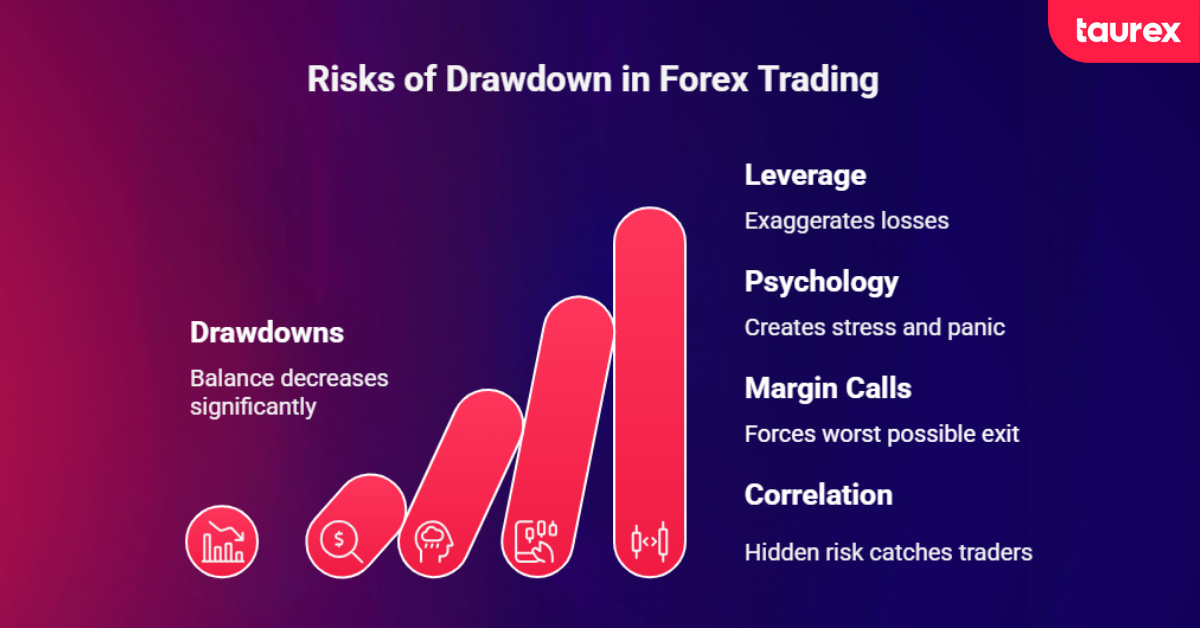
- Leverage makes drawdowns much bigger. Forex is a leveraged market, and that changes the maths on drawdown significantly. Because traders control large positions with a small amount of margin, even small pip movements can cause big swings in your balance. A $10,000 account using 50:1 leverage on a 1-lot EUR/USD position can see a $2,000 loss from a 200-pip move against you, which is a 20% drawdown from a single trade. Without leverage, the same move on a 0.01-lot position would be just $20.
- Psychological pressure builds over time. Long drawdowns create stress that can lead to panic exits and revenge trading, where a trader increases position sizes trying to recover losses quickly. This almost always makes the drawdown worse rather than reversing it.
- Margin calls force the worst possible outcome. As your balance falls through a drawdown, you get closer to your broker’s margin threshold. If your balance drops below that level, your positions get closed at whatever price the market is offering, which is usually the worst possible moment to exit.
- Hidden correlation risk can catch you off guard. Holding long positions in EUR/USD and GBP/USD at the same time might feel like two separate trades, but these pairs tend to move together. A dollar rally can hit both positions at the same time, creating a much bigger combined drawdown than either position alone would suggest. Spreading positions across less correlated pairs like USD/JPY and AUD/NZD can help reduce this.
How Investors and Traders Manage Drawdown
Losses aren’t a question of “if” but “when.” The real question is how they’re contained. Here’s the practical toolkit that experienced traders tend to rely on.
- The 1 to 2% risk rule: Limiting risk to 1 to 2% of your account balance per trade means that even a brutal 10-trade losing streak only produces a 10 to 20% drawdown, which is still recoverable. This single rule does more to protect accounts than almost anything else.
- Stop-loss on every trade: Stop-loss orders turn a potentially unlimited floating loss into a defined, manageable fixed loss. Some brokers also offer guaranteed stop-loss orders that protect against slippage during volatile conditions. At Taurex, stop-loss tools are built into the platform so traders can set them easily on every position.
- Set a drawdown cap: Decide on the maximum drawdown you’re willing to accept, whether that’s 10%, 15%, or 20%. When your account gets close to that level, pause trading and review your strategy before placing another trade.
- Spread across non-correlated pairs: Don’t concentrate all your capital in one currency or a cluster of closely related pairs. Spreading positions across instruments like USD/CHF, AUD/USD, and EUR/JPY, each driven by different economic factors, helps reduce the chance of one market move hurting everything at once.
- Keep a positive risk-to-reward ratio: Aiming for at least a 1:2 or 1:3 risk-to-reward ratio means even a 40% win rate can be profitable over time, because each winner more than makes up for each loser.
- Set monthly drawdown limits: If your overall maximum drawdown cap is 30%, consider setting a monthly cap of around 5 to 6%. When the monthly limit is reached, reduce your position sizes or step back until the next month begins.
- Use an equity stop-loss: This is account-level protection. An equity stop works like a standard stop-loss but triggers across all open positions at once. If your total floating losses reach a set threshold, for example, $3,000 on a $10,000 account, everything closes automatically.
- Backtest before going live: Testing strategies on past data shows what the maximum and average drawdown looked like before real money is at risk. This sets realistic expectations and helps you set all of the above limits sensibly. Learning how to read charts and apply technical analysis feeds directly into this process.
Common Examples of Drawdowns in Forex Trading
Retail Trader Account Drawdown
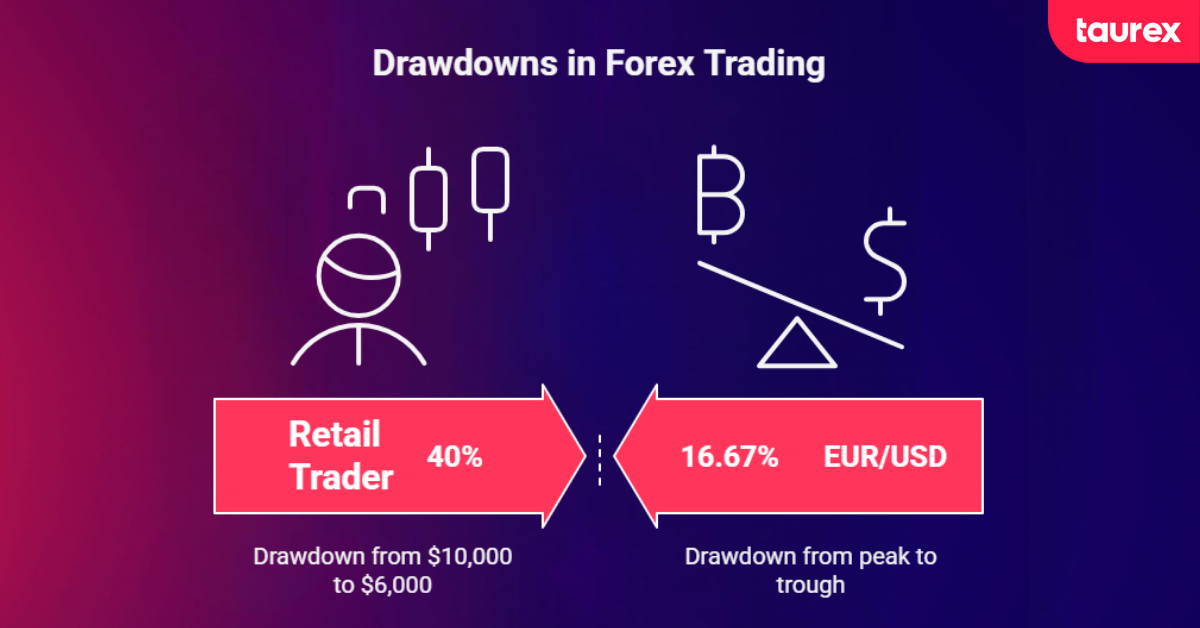
A trader starts with $10,000. After a difficult stretch, the account drops to $6,000, which is a 40% drawdown. Getting back to $10,000 from $6,000 requires a 66.7% gain, not 40%. This example shows clearly why keeping drawdowns small is so central to long-term trading discipline.
EUR/USD Single-Trade Scenario
A trader enters EUR/USD long at 1.1000. The price climbs to 1.2000 (peak) before falling to 1.0000 (trough). The drawdown from peak to trough is 16.67%. But the trader entered at 1.1000, so their actual floating loss at the trough is 1,000 pips, not 2,000. This is an important reminder that drawdown measures the price fall, while your personal loss depends entirely on where you entered the trade.
The 2008 Financial Crisis
During the 2008 global financial crisis, the S&P 500 fell around 57% from its October 2007 peak to its March 2009 trough. In Forex markets, currency pair bid-ask spreads expanded by over 400% during the worst periods, according to CEPR. Even well-managed accounts faced extreme volatility-driven drawdowns in major pairs, a reminder that wider market events can override individual trade planning.
Conclusion
Drawdowns aren’t a bug in Forex trading; they’re a permanent part of it. Every strategy, no matter how well-built, will go through periods of decline. What separates traders who reach their goals from those who don’t comes down to planning: knowing your drawdown type, setting a clear cap, using stop-losses without exception, sizing positions so that losing streaks are survivable, and measuring strategies through the Calmar Ratio rather than raw returns alone.
The traders who take time to understand drawdown build the discipline to manage it. Take the time to build drawdown awareness into every part of your trading plan, because the market rewards preparation far more than optimism. If you’re ready to get started, you can open a trading account with Taurex and use our built-in risk tools to monitor your drawdown from day one.
FAQ
What is a daily drawdown in Forex trading?
Daily drawdown in Forex trading is the maximum amount your account can fall in a single trading day, measured from the day’s starting balance or equity. It helps traders track short-term risk and limit how much can be lost before trading stops for the day.
For example, if your Forex account starts the day at $10,000 and drops to $9,700, the daily drawdown is 3%. Traders use daily drawdown limits to protect capital, control losses, and stop one bad trading session from turning into a much larger account decline.
What is a good drawdown?
It depends on context. Institutional traders and hedge funds typically aim for maximum drawdowns under 5 to 10%. For retail traders, a maximum drawdown under 20% is broadly seen as healthy. Accounts with larger balances should aim to keep drawdown below 6%, while smaller accounts might accept 15 to 20% before risk becomes a concern.
Ultimately, “good” depends on returns as well. A 15% drawdown is more acceptable if the strategy is generating 40% annually, and the Calmar Ratio helps frame that relationship clearly.
What is a good maximum drawdown for a trading strategy?
A “good” maximum drawdown depends on the strategy, timeframe, and risk level, but for most retail trading systems, it is generally considered acceptable if it stays under about 10% to 20%. Lower drawdowns usually indicate better risk control and smoother equity performance, but very low drawdowns can also mean lower returns.
The key is not a single number, but whether the drawdown is consistent with the strategy’s expected risk and return profile.
How can I reduce my drawdown?
Risk 1 to 2% of your account per trade as a maximum. Use a stop-loss order on every position without exception. Spread your exposure across non-correlated currency pairs rather than concentrating in one group. Keep a risk-to-reward ratio of at least 1:2. Set monthly and overall drawdown caps and step back when they’re hit.
Avoid placing trades during high-impact news events without a clear plan. Backtest your strategy to understand its historical drawdown profile before putting real money at risk, and keep a trading journal to spot which setups tend to produce the deepest drawdowns in your own trading.
What is the maximum drawdown in trading?
Maximum drawdown is the largest drop in your account balance from a peak to a low point. It shows how much your account has fallen before it starts to recover. Traders use it to understand the worst-case risk of a strategy.
What is the difference between drawdown and loss?
A loss is the result of a single trade that ends in the negative. A drawdown is the total drop in your account over time, often caused by a series of losses. In simple terms, a loss is one trade, while a drawdown reflects the bigger picture.
Can I be profitable and still have a drawdown?
Yes, this is completely normal. Even profitable traders go through periods where their account drops before it grows again. What matters is that your overall gains are larger than your drawdowns over time.
What happens if the drawdown gets too high?
If your drawdown becomes too large, it becomes harder to recover. For example, a 50% loss means you need a 100% gain just to break even. High drawdowns also increase stress and can lead to poor decisions, so it is important to control risk early.

