


Despite all the new government stimulus recently announced to support the Chinese economy, where the government pledged a significant increase in debt on Saturday, it has left investors puzzled about the overall size of the stimulus package. Recent economic data shows that the Chinese economy is struggling. Specifically:
- The main consumer price index fell year-on-year in September by 0.0%, a figure lower than expectations and the previous reading (0.4%).
- The producer price index declined year-on-year, registering a contraction of 2.8%, which is lower than expectations (-2.5%) and the previous reading (-1.8%).
- The imports index declined year-on-year in September, recording a growth of 0.3%, which is less than expectations (0.9%) and the previous reading (0.5%), indicating weak domestic demand.
- The exports index decreased, recording a growth of 2.4%, which is lower than expectations (6.0%) and the previous reading (8.7%), suggesting weak external demand.
- The real estate sector, which represents about 30% of China’s GDP, remains troubled.
- Tensions between China and the United States regarding trade and technology, as well as the Taiwan issue, persist.
Goldman Sachs raised its growth forecast for the Chinese economy to 4.9% this year, compared to a previous forecast of 4.7%, and also expects growth of 4.7% in 2025 compared to a previous forecast of 4.3%, following stimulus measures to support the economy. However, it warned that structural challenges such as debt burdens and issues related to global supply chains will remain.
Markets are awaiting on Friday indicators of fixed asset investment, GDP, industrial production, retail sales, and unemployment rates in China.
As for stock markets, the Hang Seng and CSI 300 indices have risen by approximately 23% and 15%, respectively, since the beginning of the year to date.
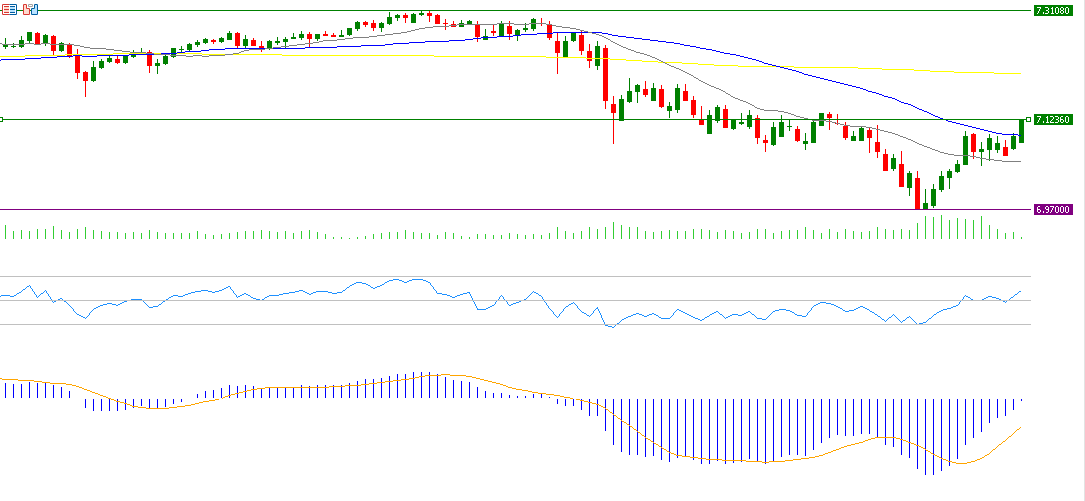
Regarding the USD/CNH pair, it has risen by about 2% since the low on September 27, 2024, which was 6.9691, to the current levels at 7.1236.
Notably, a significant factor providing positive momentum for the USD/CNH pair is the strong U.S. labor market and inflation data, along with a reduced likelihood of a 50 basis point rate cut. Currently, markets are pricing in an 80% chance of a 25 basis point rate cut and a 20% chance of keeping rates steady at the next Federal meeting on November 7.
Technically, the USD/CNH pair is trading close to levels of 7.1230, with the next challenge being to break through the resistance level, which is the 200-day moving average in yellow at 7.2023.
The Relative Strength Index (RSI) currently registers around 58 points, indicating bullish momentum for the USD/CNH pair. The MACD indicator in blue is above the orange signal line, indicating positive momentum for the USD/CNH pair.
Please note that this analysis is provided for informational purposes only and should not be considered as investment advice. All trading involves risk.



