The USD/CNY exchange rate has been trading sideways over the past two weeks within a horizontal range between 7.1800 and 7.2500, searching for a clear direction, either upward or downward. The pair is down approximately 2% year-to-date.
As for the Hang Seng Index, it has risen by around 17% since the beginning of the year, outperforming American, European, and Japanese stock indices. Additionally, the Hang Seng Tech Index has gained about 18% during the same period, outperforming the U.S. Nasdaq 100 Index, particularly the performance of the “Magnificent Seven” stocks.
Recent Chinese economic data has been mixed. The April industrial production index came in higher than analysts’ expectations, posting 6.1% year-on-year growth, compared to forecasts of 5.7%. Meanwhile, the unemployment rate dropped to 5.1%, which is below both the expected rate and the previous reading of 5.2%.
On the other hand, retail sales growth slowed in April, registering a 5.1% increase year-on-year—below expectations of 6.0% and the prior reading of 5.9%. Additionally, fixed asset investment slowed to 4.0%, falling short of expectations (4.4%) and the previous reading (4.2%).
Despite reaching a preliminary trade agreement between China and the United States, uncertainty remains over future trade relations. Tensions persist, particularly regarding technological competition and artificial intelligence.
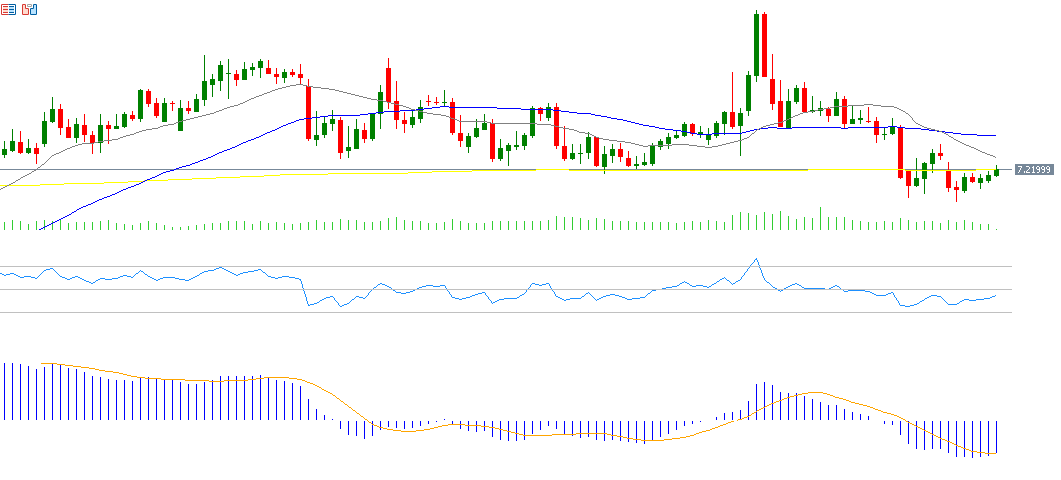
From a technical perspective, indicators point to potential downward pressure on the USD/CNY pair in the near term, due to several reasons:
- Bearish Crossover: The 20-day moving average (grey) crossed below the 50-day moving average (blue) at 7.2402 and 7.2640, respectively, on May 8, 2025.
- Relative Strength Index (RSI): Currently around 42, indicating bearish momentum.
- MACD Indicator: The MACD line (blue) is below the signal line (orange) and both are in negative territory, reflecting ongoing negative momentum.
In terms of support and resistance levels, if the pivot point at 154.32 is broken to the downside, the pair could target support levels at 152.65, 151.43, and 149.76. Conversely, if the pivot point is breached to the upside, the resistance targets would be 155.54, 157.21, and 158.43.
Please note that this analysis is provided for informational purposes only and should not be considered as investment advice. All trading involves risk.


