
On Wednesday, January 29, 2025, the U.S. Federal Reserve decided to keep interest rates unchanged at 4.25%-4.50%, in line with expectations. However, the key highlight was Fed Chair Jerome Powell’s statement, where he emphasized that there is no need to rush interest rate cuts. He stressed the importance of seeing further progress in controlling inflation and noted that the economy remains strong. Powell also mentioned that the Fed is closely monitoring the policies of the new Trump administration, stating that more clarity is needed before assessing their economic impact.
Notably, the phrase “inflation is moving toward its target” was removed from the Fed’s statement accompanying the interest rate decision.
Performance of U.S. Stock Indices in Recent Days
Since the beginning of the year, U.S. stock indices have recorded notable gains:
- The S&P 500 has risen by approximately 3%.
- The Nasdaq 100 has increased by about 2%.
- The Dow Jones has surged by nearly 6%.
- The Russell 2000 (which tracks small and mid-sized companies) has gained around 3%.
This positive momentum appears to be continuing, despite potential risks and challenges, including:
- Prolonged Higher Interest Rates:
- The expectation that the Fed will keep interest rates elevated for a longer period could lead to rising U.S. Treasury yields, strengthening the U.S. dollar.
- A stronger dollar could negatively impact risk assets such as equities, particularly U.S. companies with significant exports.
- The 10-year U.S. Treasury yield climbed to 4.80% on January 14, 2025, its highest level since November 1, 2023.
- Some forecasts suggest yields could reach 5%, as seen in October 2023, especially amid persistent inflation pressures and uncertainty over President Trump’s economic policies.
- Uncertainty Surrounding Tariffs:
- There is still a lack of clarity regarding Trump’s proposed tariffs on imported goods, including their rates, timeline, and target countries.
Factors Supporting U.S. Markets
Despite market pressures, several factors continue to support U.S. stocks:
- Strong Corporate Earnings Performance:
- In the banking sector, major U.S. banks reported revenues and earnings that exceeded analysts’ expectations in Q4 2024, with the exception of Wells Fargo, which missed revenue forecasts.
- Wells Fargo surprised the market by projecting higher net interest income in 2025 compared to 2024.
- Citigroup announced a new $20 billion share buyback program, representing about 14% of its market capitalization.
- As a result, the KBW Bank Index of U.S. bank stocks has risen 10% year-to-date, outperforming both the S&P 500 and Nasdaq 100.
- Strong Demand for AI and Semiconductor Stocks:
- Despite competition from China’s DeepSeek, which has impacted investment decisions for major U.S. tech companies, AI-related stocks continue to show strong momentum.
- Meta and Microsoft reported earnings that beat expectations.
- Meta announced capital expenditures of $60-65 billion for AI projects in 2025, compared to $37.28 billion in 2024—higher than the prior estimate of $52.4 billion, signaling aggressive expansion.
- However, Microsoft’s cloud computing segment saw a slowdown in Q4 2024, negatively impacting its stock price.
- Tesla’s earnings fell short of expectations, but the company’s outlook remains positive for 2025, particularly in sales, which helped boost its stock.
- Support for Domestic Manufacturing:
- President Trump has pledged to support the U.S. manufacturing sector by reducing corporate taxes.
- His immigration policies, including the deportation of undocumented workers, could potentially boost employment for U.S. citizens and benefit industrial stocks.
Market Focus on Key Economic Data
Today, at 5:30 PM UAE time, markets are closely watching the release of the Core PCE Price Index, which excludes food and energy and is the Fed’s preferred inflation measure.
- Expectations suggest it will remain stable at 2.8%.
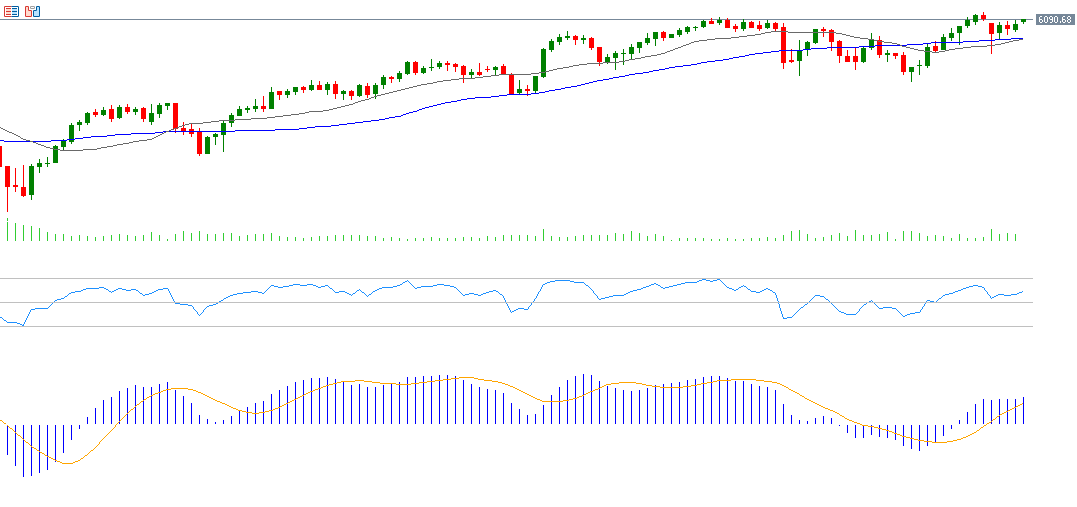
Technical Analysis of the S&P 500
Despite existing pressures, technical indicators still support the S&P 500’s upward trend:
- Golden Cross Formation:
- The 20-day moving average (5,972 points) is approaching the 50-day moving average (5,987 points), signaling a potential bullish crossover.
- MACD Indicator:
- A bullish crossover has formed, with the MACD line (blue) crossing above the signal line (orange)—a positive sign for upward momentum.
- Relative Strength Index (RSI):
- Currently at 56 points, indicating bullish momentum.
The key challenge for the S&P 500 will be surpassing 6,128 points, its all-time high reached on January 24, 2025.
Please note that this analysis is provided for informational purposes only and should not be considered as investment advice. All trading involves risk.


