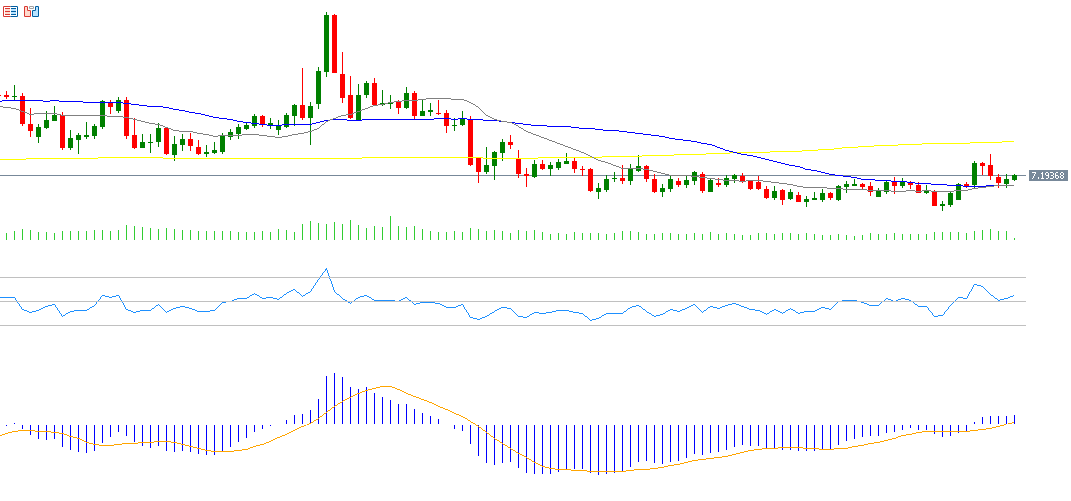
The USD/CNH pair has been trading in a horizontal sideways range between 7.1500 and 7.2300 over the past three months, struggling to find a clear direction—whether upward or downward. The pair has declined by around 2% year-to-date.
As for the Hang Seng Index, it has surged by approximately 24% since the beginning of the year, outperforming American, European, and Japanese stock indices. Similarly, the Hang Seng Tech Index has climbed by a comparable percentage over the same period, outperforming the U.S. Nasdaq 100 Index.
Recent Chinese economic data has been mixed. The Manufacturing PMI dropped into contraction territory at 49.3, below both expectations and the previous reading of 49.7. The Services PMI also declined, recording modest growth at 50.1, again below expectations (50.3) and the previous reading (50.5). Finally, the Caixin Manufacturing PMI slipped into contraction at 49.5, lower than both expectations (50.2) and the previous reading (50.4).
On the other hand, the Caixin Services PMI showed stronger performance, rising to 52.6, which is higher than expectations (50.4) and the previous reading (50.6).
Despite the trade truce between China and the United States, uncertainty continues to cloud the future of trade relations between the two countries, along with growing rivalry in the fields of technology and artificial intelligence.
Technical Outlook: Signs Point to a Potential Upside for USD/CNH
From a technical standpoint, indicators suggest a possible upside for the USD/CNH pair in the coming period due to several reasons:
- Golden Cross Formation: There is a convergence between the 20-day moving average (grey) and the 50-day moving average (blue). A bullish crossover between the two may confirm an upward trend.
- Relative Strength Index (RSI): Currently stands around 56, indicating bullish momentum.
- MACD Indicator: The blue line is above the signal line (orange), pointing to continued positive momentum.
In terms of support and resistance levels:
If the pivot point at 7.1832 is broken to the downside, the pair could head toward the following support levels: 7.1769, 7.1699, and 7.1636.
On the other hand, if the pair breaks above the pivot point, resistance levels may be targeted at 7.1902, 7.1965, and 7.2035.
Please note that this analysis is provided for informational purposes only and should not be considered as investment advice. All trading involves risk.

