
The S&P 500 index closed at 5,709 points yesterday, remaining up about 20% since the beginning of the year through yesterday’s close. This index is experiencing pressures and fluctuations due to several factors, the most notable of which are:
- The escalation of geopolitical tensions in the Middle East at this time, with fears that the war could expand to include other regions and countries, which may create negative momentum for the stock markets, especially as they are considered high-risk assets.
- The rise of the U.S. dollar index, which measures the dollar’s performance against a basket of six major currencies, registering 101.80 points today, the highest level since September 12, 2024. It is currently hovering around 101.77 points. The U.S. dollar is considered a safe-haven asset, with investors turning to it amid the current geopolitical conditions.
- Labor market data exceeding analysts’ expectations, such as the job openings and the change in non-farm private sector jobs reported by ADP, which recorded 8.040 million and 143,000, respectively, indicating the strength of the U.S. labor market. This has shifted market bets from the Federal Reserve potentially cutting interest rates by 25 basis points instead of 50 in the upcoming Fed meeting scheduled for November 7, 2024.
The markets are closely anticipating the release tomorrow of the non-farm payroll report, the unemployment rate, and average hourly wages in the United States, which will directly impact stock market movements.
Forecasts suggest that the U.S. economy will add 146,000 new jobs in September after adding 142,000 jobs in August. As for the unemployment rate, forecasts indicate it will stabilize at 4.2%, matching the August reading. Finally, analysts expect that average hourly wages will register an annual increase of 3.3%, which is lower than the August reading of 3.8%.
Therefore, caution is advised; any reading that comes in below expectations for jobs and wages, and above expectations for the unemployment rate, indicates a significant likelihood of positive impacts on U.S. stocks.
Additionally, the markets are closely awaiting the release of U.S. corporate earnings for the third quarter of this year, starting next week.
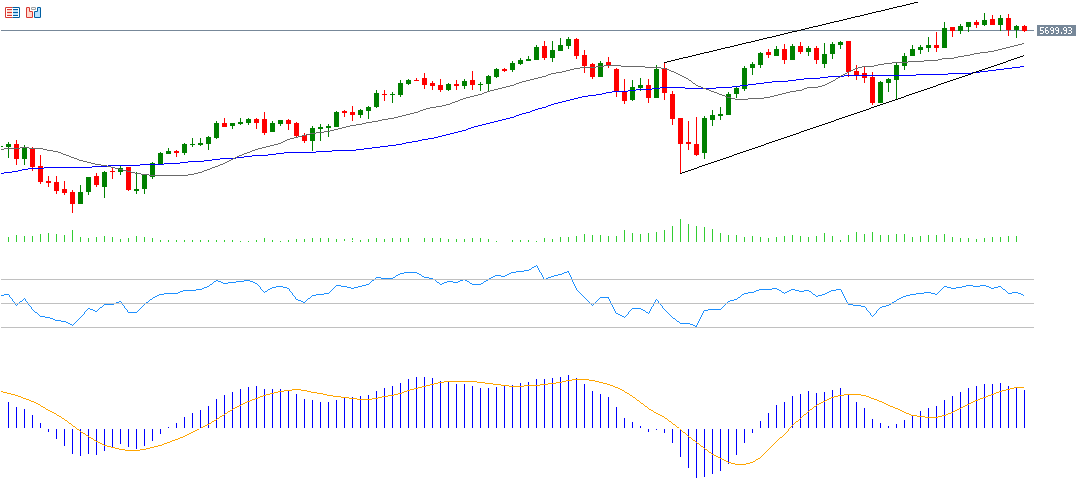
Despite the pressures faced by the S&P 500 index, technical indicators still support it for several reasons:
First: The alignment of the 20-, 50-, and 200-day moving averages and their upward trend, with the 20-day average exceeding the 50-day average, and the 50-day average exceeding the 200-day average.
Second: The Relative Strength Index (RSI) currently at 59 points, indicating upward momentum for the S&P 500.
The biggest challenge for the S&P 500 is to reach the level of 5,767 points, which is the record level it achieved on September 26, 2024, and to surpass it.
Please note that this analysis is provided for informational purposes only and should not be considered as investment advice. All trading involves risk.


