Key Points
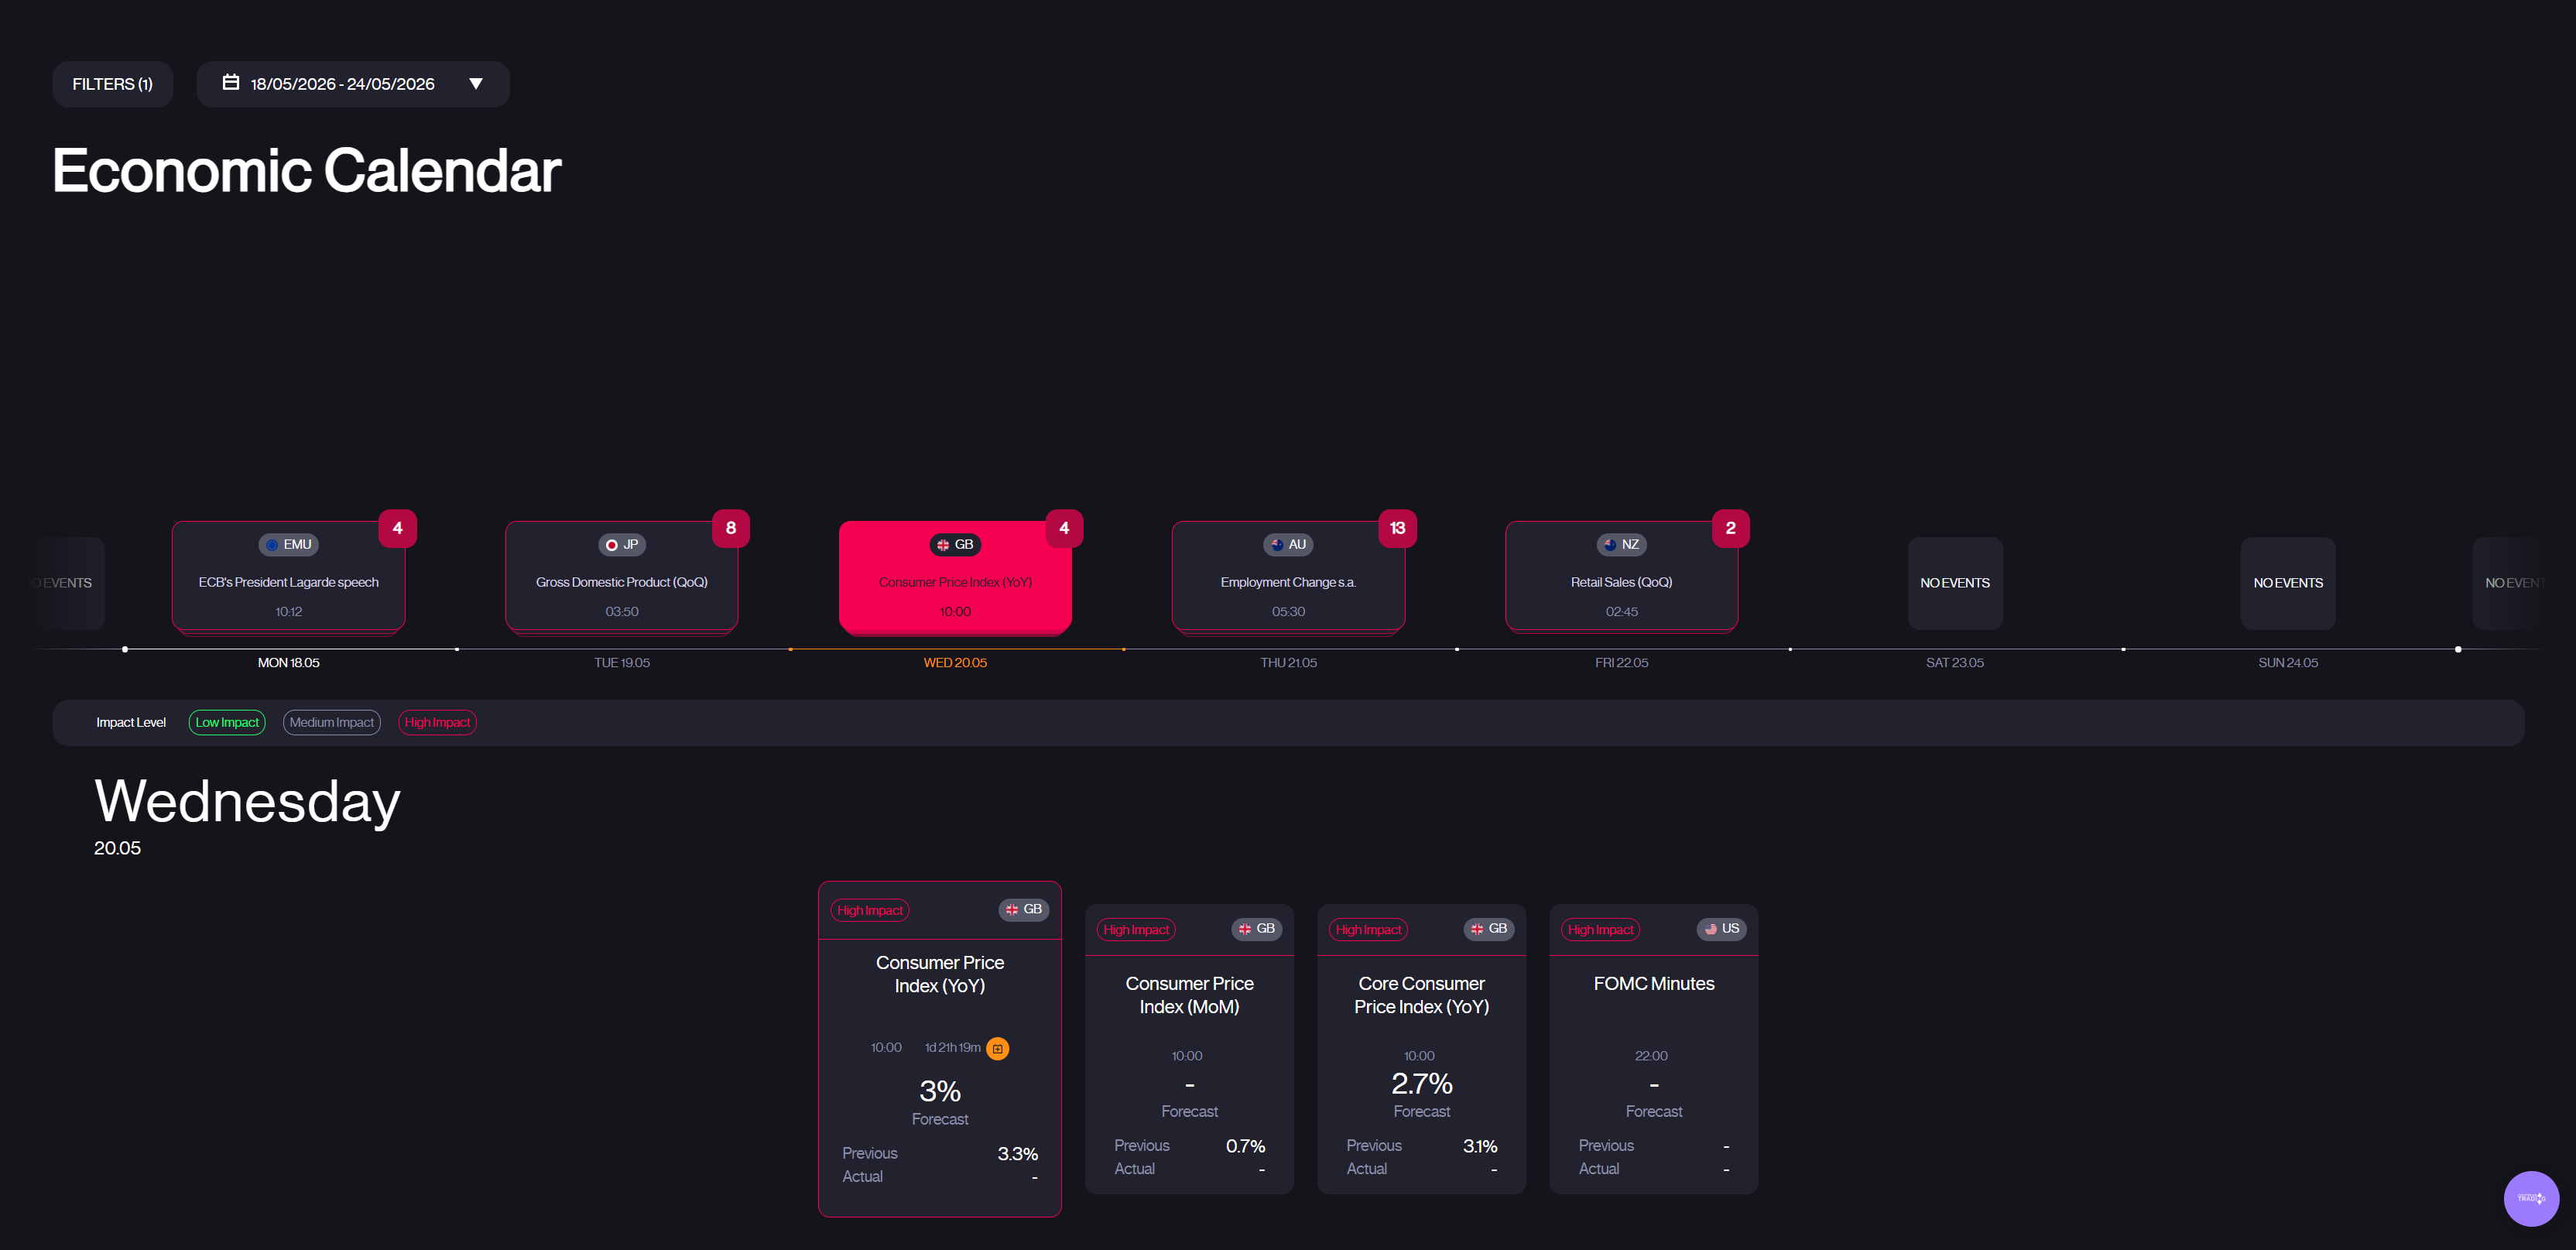
- The FOMC minutes from Powell’s final meeting land on Wednesday, revealing how deeply the committee was split when it voted 8 to 4 to hold rates. Kevin Warsh was confirmed as the 17th Federal Reserve Chair in a historic 54 to 45 vote, the closest in the modern era, and officially took over on Thursday.
- UK CPI data arrives on Wednesday, with headline inflation forecast to cool to 3.0% from 3.3%. Flash PMIs for the US, UK, Germany, and the Eurozone follow on Thursday, providing the first read on May business activity across major economies.
- Last week’s US CPI came in scorching hot at 3.8% year on year, half a percentage point above forecast, with energy prices accounting for over 40% of the monthly gain. WTI oil surged 11% to $106 while gold fell 4% to $4,530 as the 30 year Treasury yield broke above 5% for the first time.
The Macro Picture
Last week changed the conversation. The April CPI report came in at 3.8% year on year, the highest since May 2023 and half a percentage point above the 3.4% consensus. Energy prices rose 3.8% on the month and accounted for over 40% of the headline gain, while core CPI came in at 0.4% month on month and 2.8% year on year. This was the confirmation markets were dreading: the oil shock from the Strait of Hormuz is no longer just a supply story. It is now embedded in consumer prices.
The bond market reacted instantly. The 30 year Treasury yield broke above 5% for the first time, the 10 year climbed to 4.47%, and rate cut expectations for 2026 have essentially been wiped out. Fed funds futures now price a higher probability of a rate hike than a cut at the June meeting.
In the middle of all this, Kevin Warsh was confirmed as the 17th Federal Reserve Chair in a 54 to 45 vote, the closest for a Fed nominee in modern history. He officially took over from Jerome Powell on Thursday and now inherits an economy with 3.8% inflation, 4.3% unemployment, and oil above $100. His first FOMC meeting is June 16 to 17, but this week’s release of the minutes from Powell’s final meeting on Wednesday will be closely watched for clues on the internal debate. The 8 to 4 split at that meeting was the widest since 1992, and the minutes will show exactly where the fault lines sit.
US retail sales came in at 0.5% month on month, right on consensus. But dig into the breakdown and it tells a different story: gasoline station sales rose 2.8%, the largest category gain, while furniture fell 2% and clothing dropped 1.5%. Consumers are spending more because they have to, not because they want to.
Gold: Sell the Rally Until the Data Changes
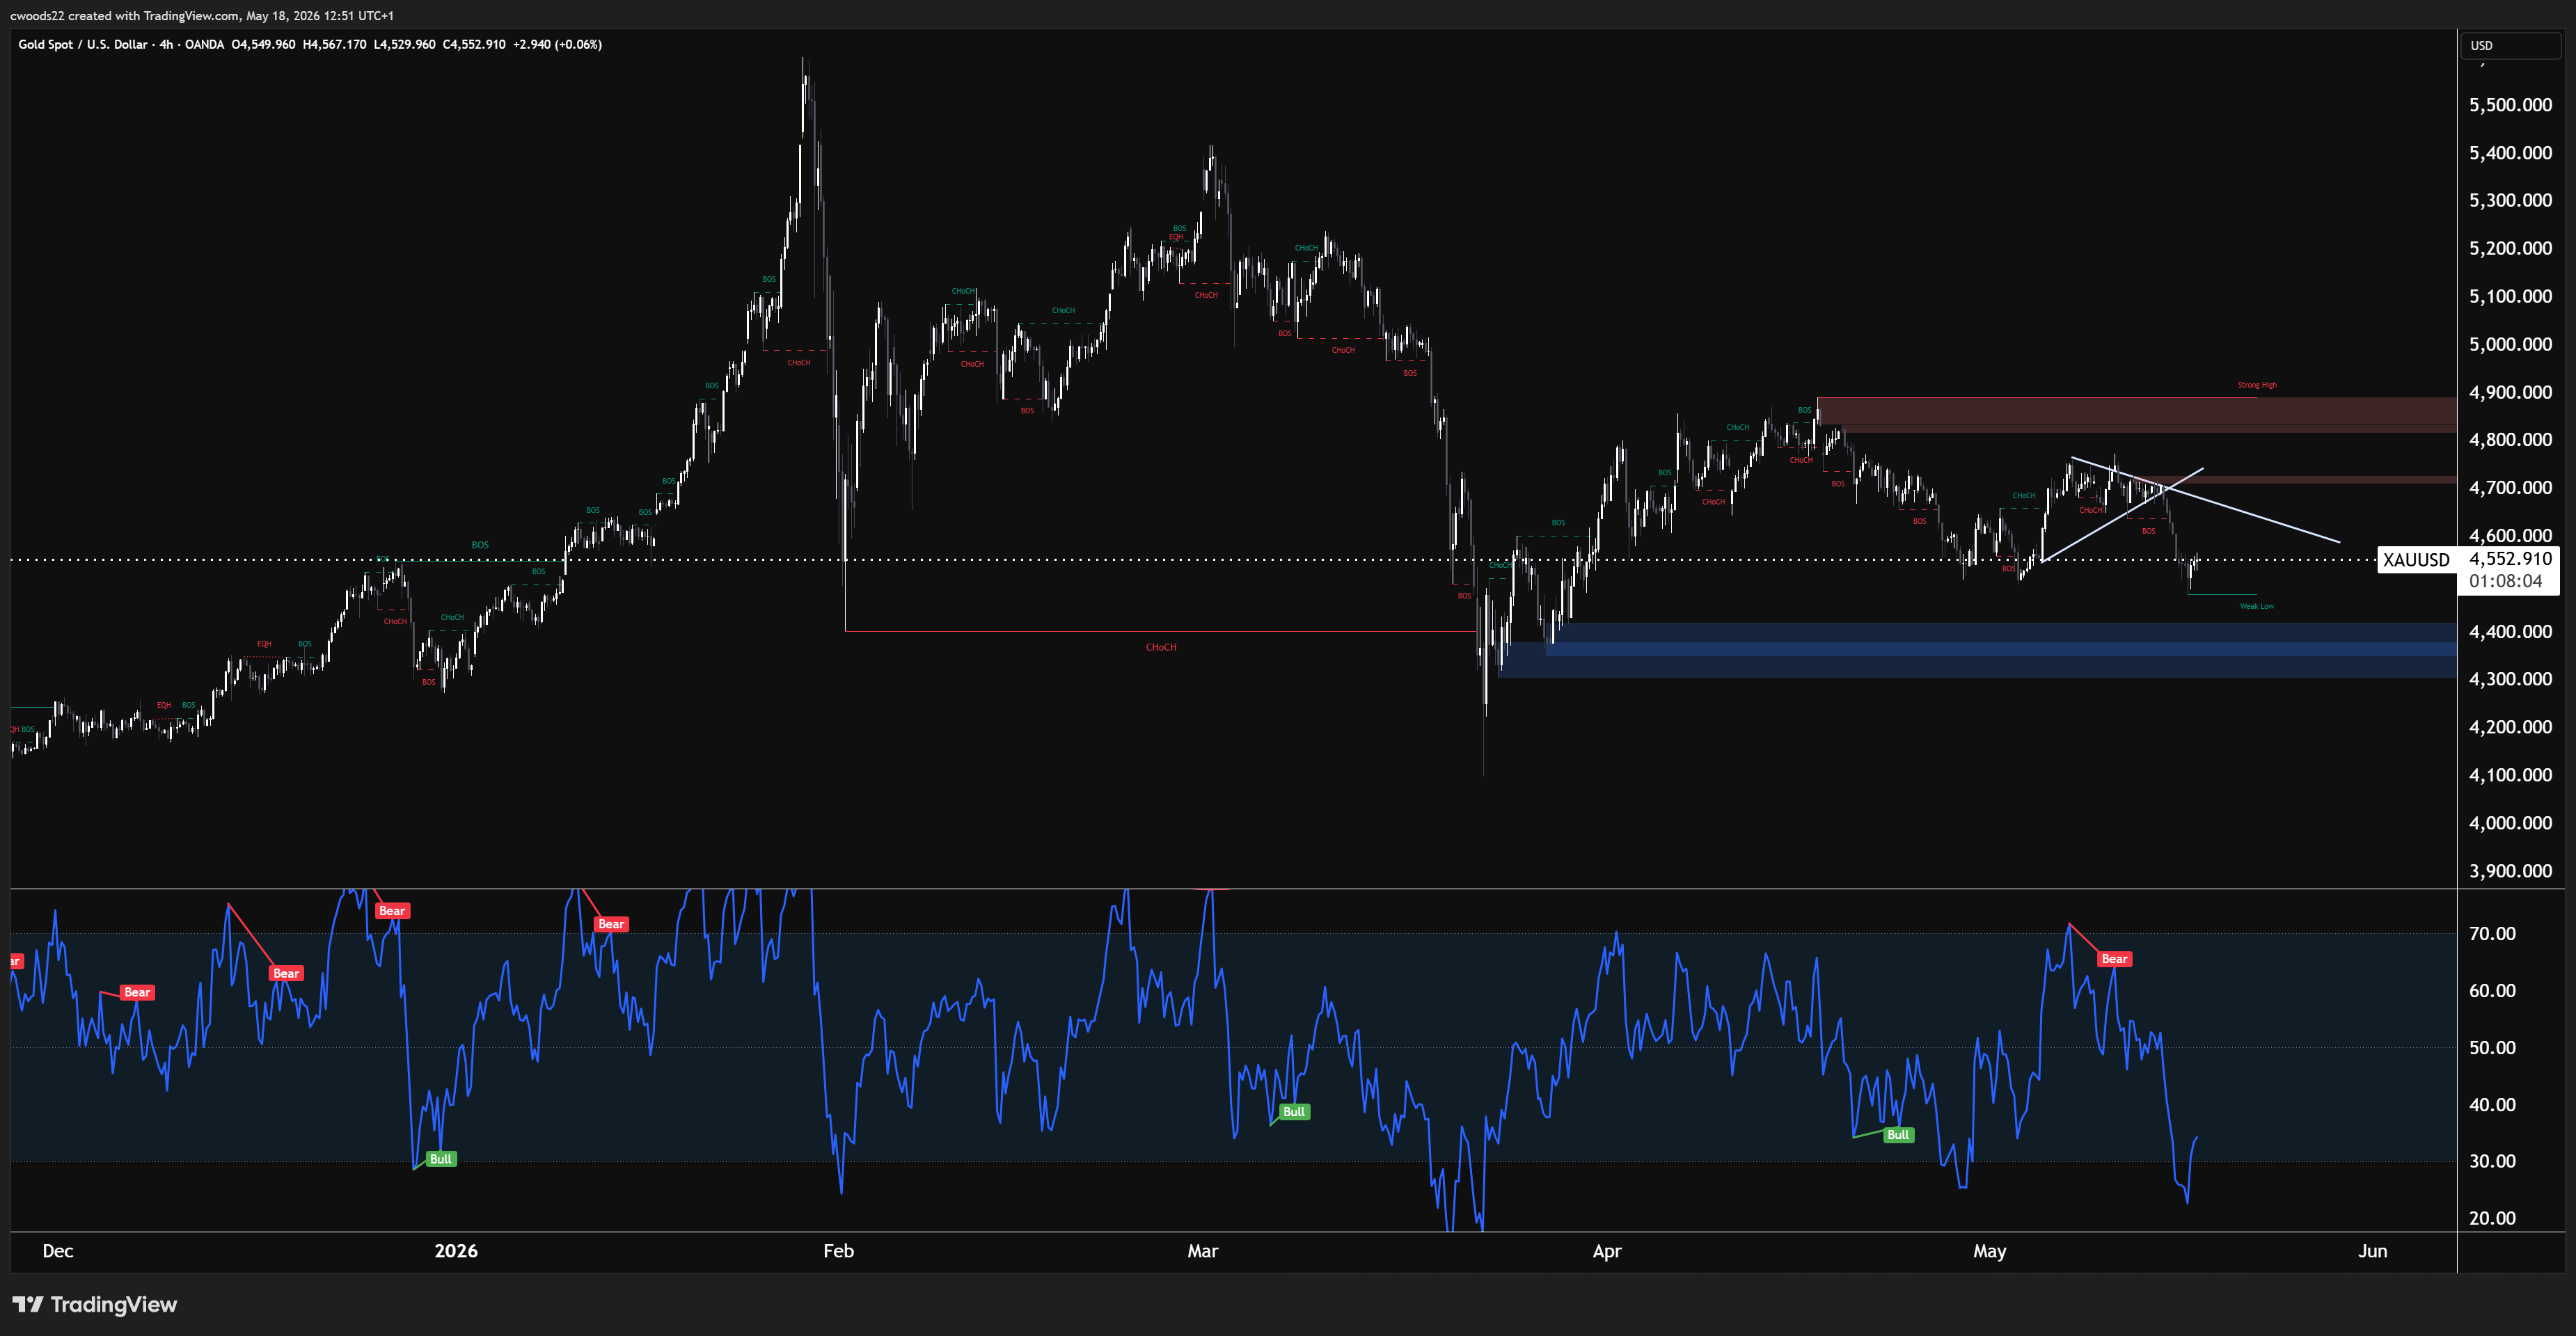
Gold sits at $4,550, down roughly 3.5% last week and extending the correction from the all-time high near $5,595. The metal has been under sustained pressure since the hot CPI print confirmed that the Fed is nowhere near cutting rates and may even be considering a hike. On the H4 chart, gold is consolidating in a range between $4,500 and $4,650 after the selloff, with resistance sitting around $4,650 to $4,700 where sellers have been stepping in on every bounce. On the downside, the key demand zone sits around $4,400 to $4,450, which is where buyers defended during the late April correction.
The fundamental backdrop has shifted against gold. The 30-year yield above 5% raises the opportunity cost of holding a non-yielding asset. The dollar is strengthening on the back of the CPI data, and rate cut expectations have been pushed into 2027. On the other side, geopolitical risk from the Strait of Hormuz and continued central bank gold accumulation provide a floor.
Wednesday is the catalyst day. The FOMC minutes could reveal that some committee members were already discussing rate hikes at Powell’s final meeting, which would be a fresh headwind for gold. On the other hand, UK CPI is forecast to fall to 3.0% from 3.3%. If the UK data shows inflation cooling while US inflation accelerates, it would reinforce dollar strength and add more pressure on gold. A move below the $4,400 to $4,450 demand zone would open the door toward $4,250. A reclaim of $4,650 to $4,700 would suggest the worst of the selling is over.
GBP/USD: Caught Between UK CPI and Dollar Strength
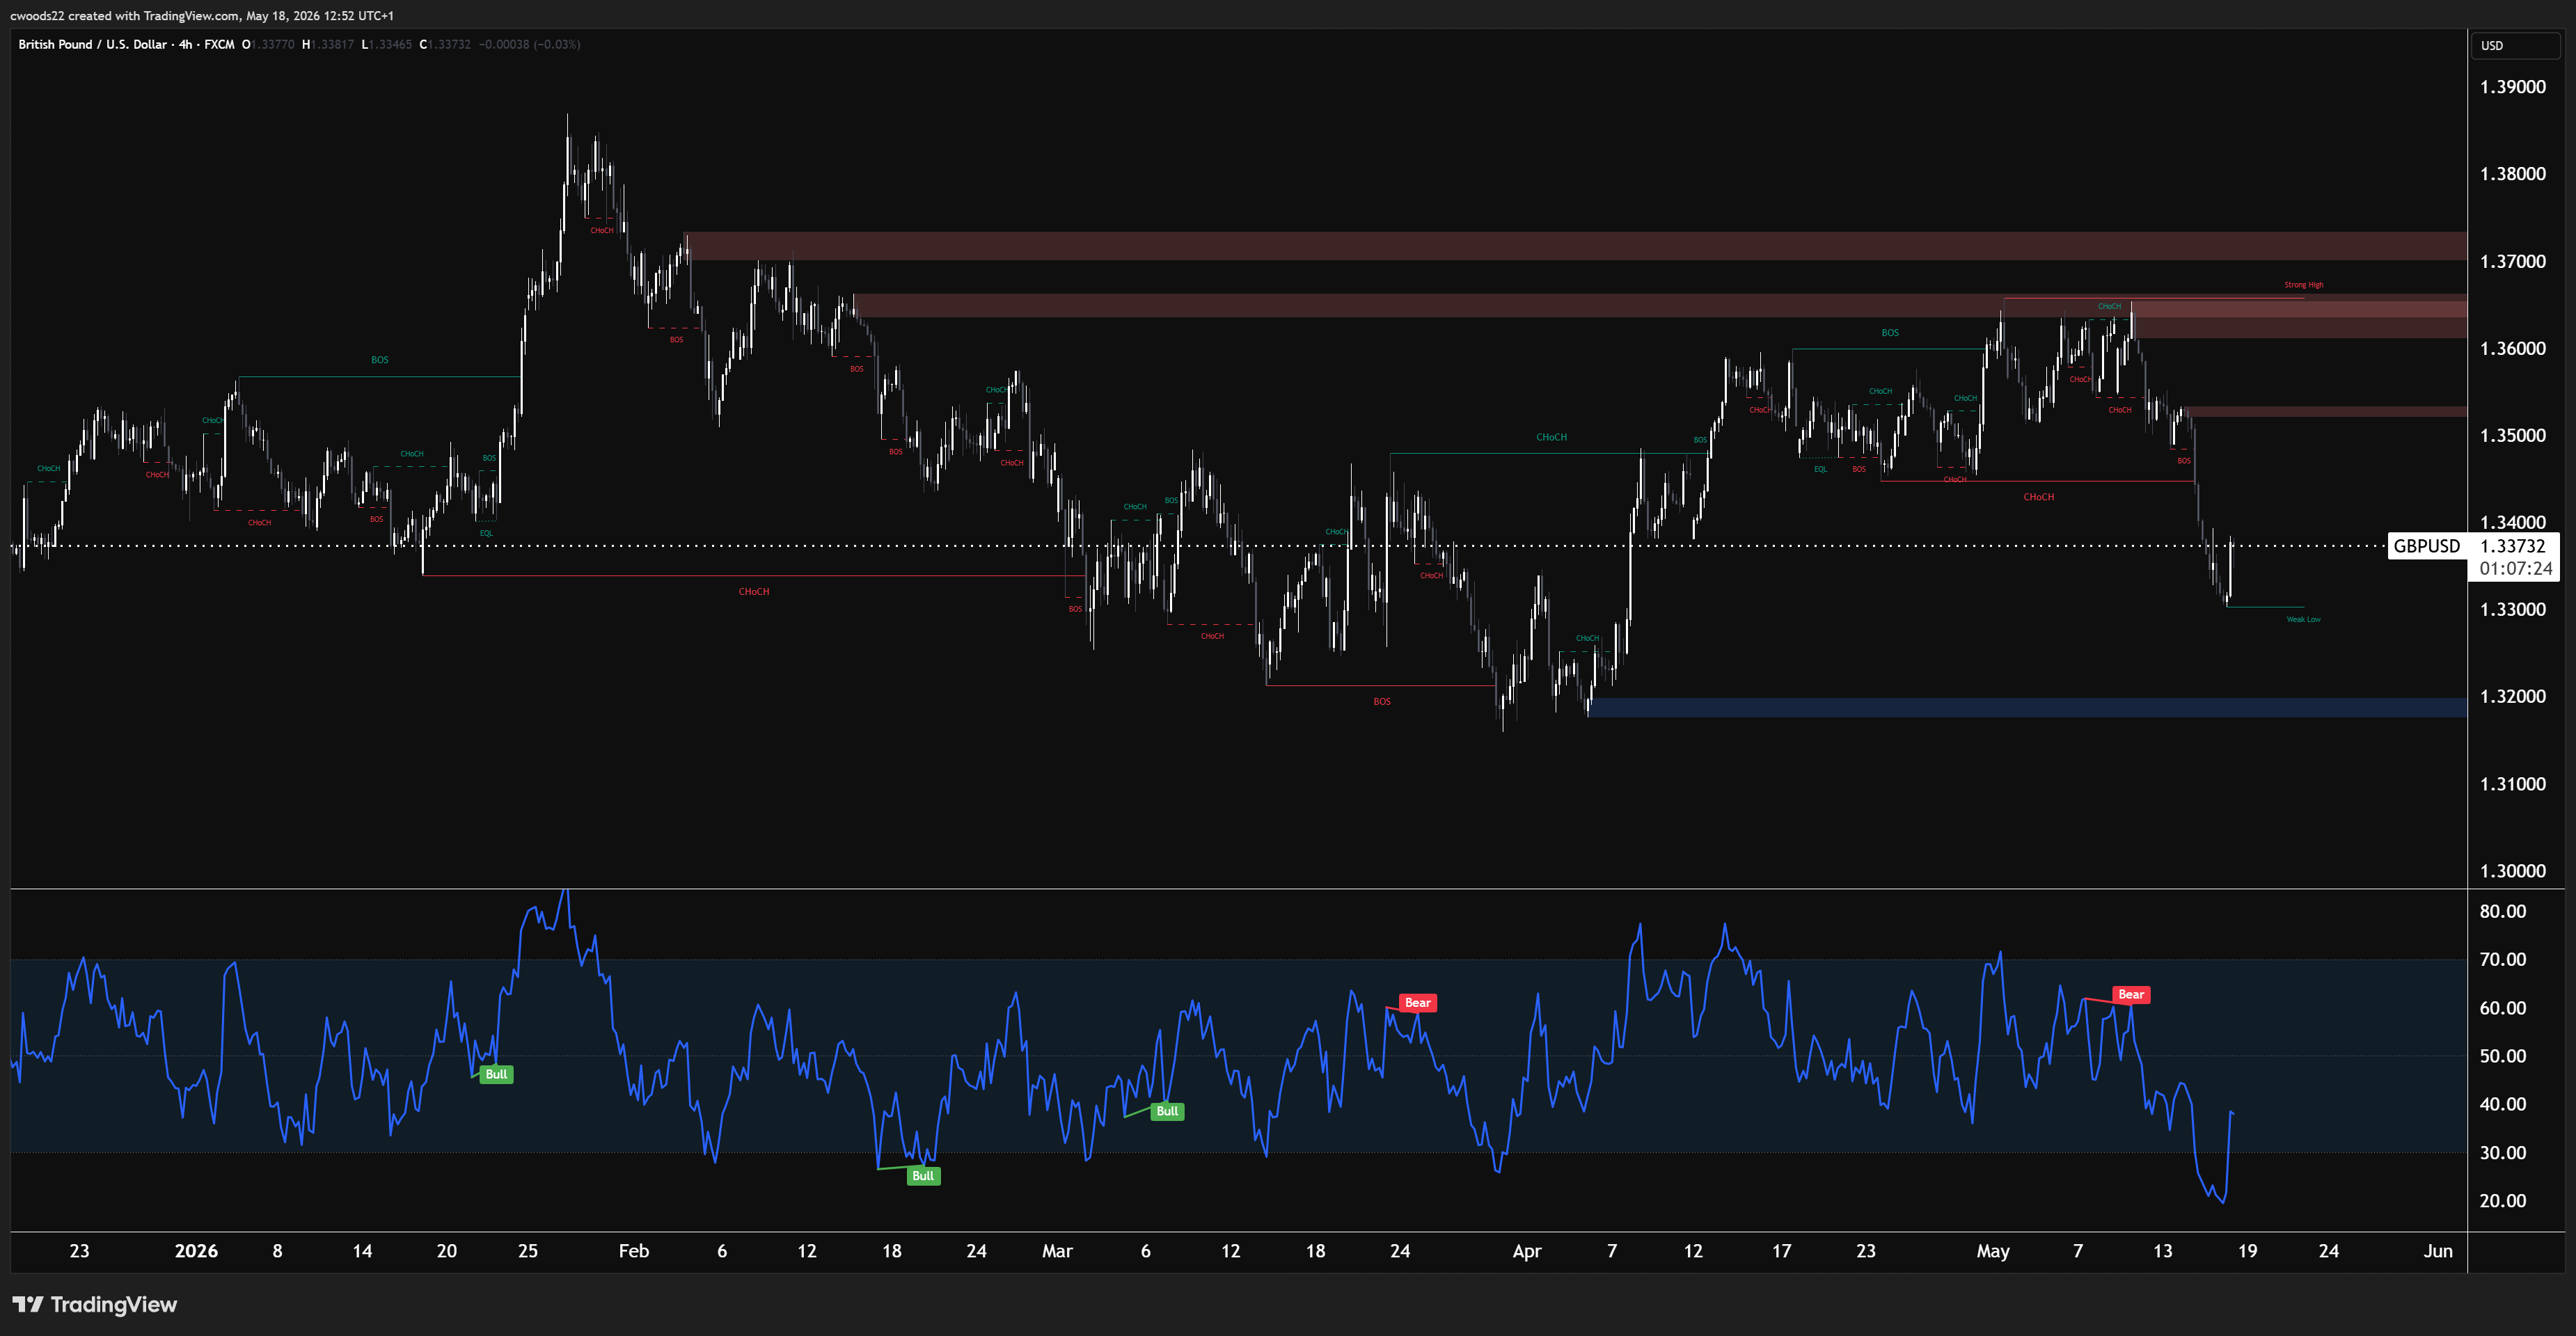
GBP/USD sits at 1.33700, well off the April highs above 1.3600 and consolidating between two clearly defined levels. On the H4 chart, there is a strong resistance zone around 1.3520 to 1.3530 where sellers have consistently stepped in. On the downside, a demand zone around 1.3100 to 1.3150 has been holding, with buyers defending that level during the most recent pullback. The current price sits roughly mid range between these two zones, suggesting the market is waiting for a catalyst to decide direction.
Last week’s UK GDP data came in at 0.6% quarter on quarter for Q1, matching the consensus and representing a sharp acceleration from Q4 2025’s 0.1%. The monthly March GDP reading actually beat expectations at 0.3% versus minus 0.2% forecast. Despite the solid data, sterling sold off after the release as the hot US CPI print later in the week drove broad dollar strength and overshadowed the UK numbers.
Wednesday is the defining day for GBP/USD. UK CPI is forecast to fall to 3.0% from 3.3%, and core CPI is expected at 2.7% year on year, down from 3.1%. If UK inflation drops while US inflation stays elevated at 3.8%, the rate differential narrative shifts firmly in favour of the dollar, which would push GBP/USD toward the 1.3100 to 1.3150 demand zone. If UK CPI surprises to the upside and beats the 3.0% forecast, it could force the Bank of England into a more hawkish stance, supporting sterling and pushing the pair back toward the 1.3520 to 1.3530 resistance. Thursday’s flash PMIs add another layer, with UK manufacturing expected at 53.5 and services at 51.7.
What to Watch This Week
Monday opens with Chinese industrial production and retail sales, followed by the preliminary Japanese GDP reading. Tuesday brings UK unemployment data (forecast 4.9%), the RBA meeting minutes from the May rate hike decision, and Canadian CPI. Two BoE speakers (Greene and Mann) are also on the calendar for Monday, which could set the tone for sterling ahead of the CPI data.
Wednesday is the big day. UK CPI lands at 06:00 UTC (headline forecast 3.0%, core forecast 2.7%), followed by the FOMC minutes at 18:00 UTC. The minutes are from the April 30 meeting where the committee split 8 to 4, the widest dissent since 1992. Markets will be looking for any discussion of rate hikes and how the committee views the oil driven inflation surge.
Thursday is PMI day. Flash manufacturing and services readings drop for Germany, the Eurozone, the UK, and the US. The US manufacturing PMI is expected at 53.8, with services at 51.3. These are the first hard data points for May and will show whether the hot CPI is starting to weigh on business sentiment. US housing starts and the Philadelphia Fed manufacturing index also land on Thursday.
Friday rounds out with UK retail sales (month on month forecast minus 0.6%, previous 0.7%) and the University of Michigan consumer sentiment reading (forecast 48.2, previous 49.8). If UK retail sales contract while US consumer sentiment continues to deteriorate, it would paint a picture of consumers on both sides of the Atlantic pulling back under the weight of higher prices.