
The US dollar against the Chinese yuan has been moving within a horizontal range between 6.8600 and 6.9400 since the beginning of the month, as the market attempts to determine a clear direction, either upward or downward. The pair has dropped by around 1.5% year-to-date.
Meanwhile, the Hang Seng Index has fallen by about 2% since the start of the year. In contrast, the Hang Seng Technology Index has dropped 15% over the same period, indicating selling pressure on Chinese tech stocks.
Recent Chinese economic data have been mixed but generally leaned toward improvement. The official manufacturing PMI rose to 50.4 points, surpassing expectations (50.1) and the previous reading (49.0). The official non-manufacturing PMI also increased to 50.1 points, exceeding expectations (49.9) and the prior reading (49.5). Industrial sector profits in China jumped 15.2% year-on-year in the first two months of 2026, marking a strong recovery compared to 0.6% growth in 2025.
On the other hand, the Caixin manufacturing PMI fell to 50.8 points, below expectations (51.6) and the previous reading (52.1), while the Caixin services PMI dropped to 52.1 points, below expectations (53.6) and the prior reading (56.7).
Markets are looking ahead to the release of China’s consumer and producer price indices on Friday.
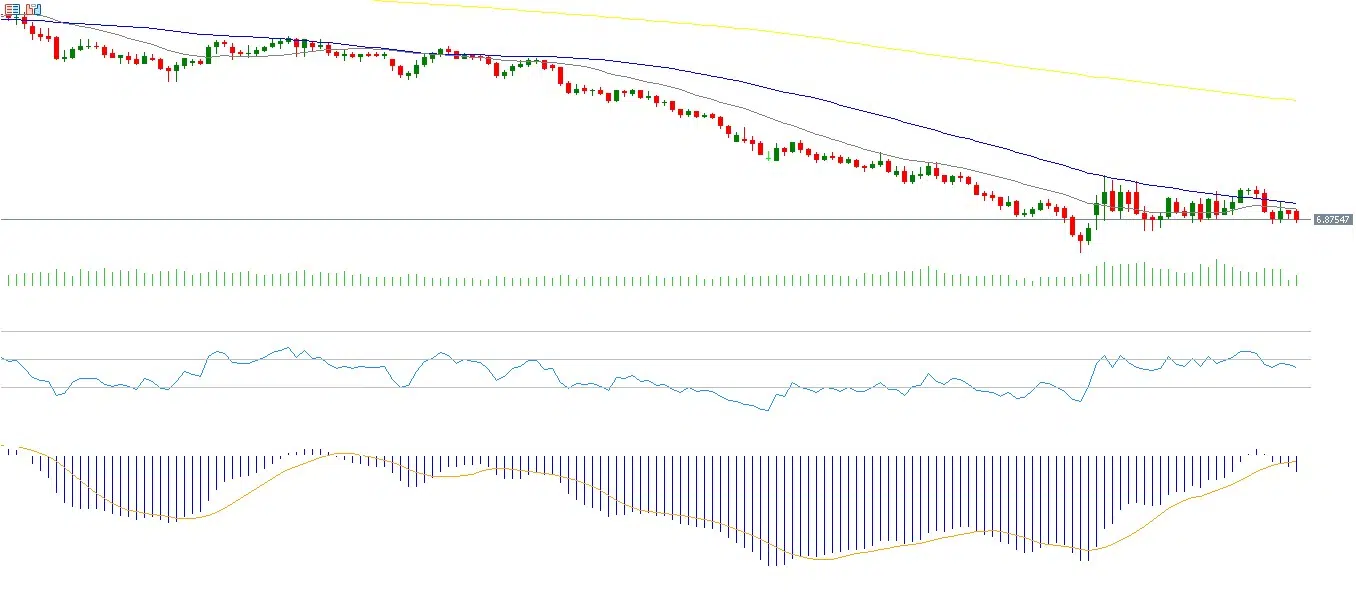
From a technical perspective, indicators suggest a negative bias for the USD/CNH pair in the near term for several reasons. First, the 20-, 50-, and 200-day moving averages remain in a bearish alignment, with the 200-day MA above the 50-day, and the 50-day above the 20-day, indicating ongoing downward momentum. Second, the relative strength index (RSI) currently stands at around 44, reflecting bearish momentum. Third, the MACD shows a bearish crossover between the MACD line and the signal line, supporting the likelihood of continued negative pressure on the pair.
Please note that this analysis is provided for informational purposes only and should not be considered as investment advice. All trading involves risk.


