
Stagflation is of course one of the worst and most dangerous scenarios that the global economy could face. As we know, it occurs when inflation rises while economic growth slows at the same time.
Expectations suggest that if the war lasts longer and expands geographically, it could have a significant impact on the global economy. We would likely see further increases in energy prices, particularly oil and natural gas, which would raise production and transportation costs. This would feed inflation across many economies around the world. At the same time, corporate investment would likely decline, and consumer spending could weaken, negatively affecting global GDP growth. As a result, the world economy could move toward a stagflationary environment.
It is worth noting that if we take the United States as an example, recent inflation readings such as Core PCE and Core PPI increased in February, even before the outbreak of the war. This is already concerning, especially since the current conflict could further fuel inflation through higher energy prices. This comes at a time when Federal Reserve Chair Jerome Powell has maintained a hawkish tone, emphasizing that there will be no interest rate cuts until inflation clearly declines, and that monetary policy must remain restrictive to ensure inflation returns to its target. Some members of the Federal Reserve have even discussed the possibility of additional rate hikes.
On the other hand, we have also seen signs of slowdown in the labor market, with the economy losing around 92,000 jobs and the unemployment rate rising to 4.4% in February. Importantly, all these figures were released before the war began. Therefore, it will be crucial to closely monitor the March labor market data this Friday, particularly the nonfarm payrolls report and the unemployment rate, in addition to the inflation data that will be released next week.
It is also important to point out a key factor, which is the inversion of the US Treasury yield curve between the two-year and three-year maturities. The yield on the two-year Treasury is currently higher than the yield on the three-year Treasury, which may signal the possibility of the US economy entering a stagflationary period.
Central banks are therefore facing a difficult dilemma. If they raise interest rates to combat inflation, this will negatively affect economic growth. However, if they cut rates to support growth, inflationary pressures could intensify. As a result, central banks are effectively caught between fighting inflation and avoiding a recession.
Market expectations suggest that both the European Central Bank and the Bank of England may continue tightening monetary policy this year to contain inflation, which is expected to remain elevated. This is particularly important for Europe and the United Kingdom, as they are highly exposed to rising energy prices due to their dependence on energy imports. Higher energy costs could therefore also weigh on economic growth.
What financial assets can be used to hedge during stagflation?
- Financial derivatives are among the most important tools used by investors to hedge or reduce risks resulting from volatility in financial markets, such as options and forward contracts.
- Treasury Inflation-Protected Securities (TIPS).
- Holding cash in safe-haven currencies such as the US dollar and the Swiss franc.
- Short-term US Treasury bills, such as one-month Treasury bills, which currently yield around 3.70% annually.
- Gold, as a hedge against inflation and a store of value.
- Defensive equities such as companies in the energy sector, utilities, and consumer staples.
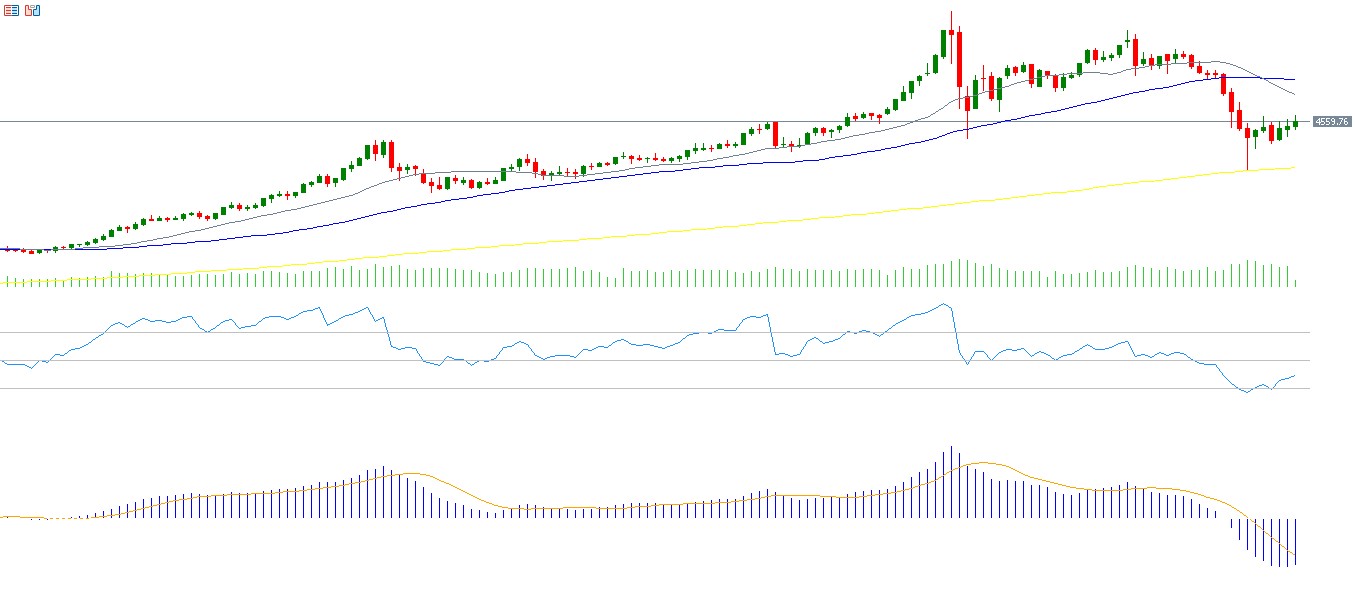
From a technical perspective, gold recently experienced a bearish crossover between the 20-day moving average, which stands around $4,815, and the 50-day moving average near $4,955. This may indicate a short-term downward trend. Meanwhile, the 200-day moving average around $4,100 represents an important strategic support level. Prices approached this level but failed to break below it, indicating its strength. In addition, the Relative Strength Index is currently around 40 points, reflecting negative momentum, while the MACD indicator shows a bearish crossover between the MACD line and the signal line, which further supports the possibility of continued downside momentum in the short term.
Please note that this analysis is provided for informational purposes only and should not be considered as investment advice. All trading involves risk.


