
Key Points
- Gold has broken above the descending trendline from the $5,500 November 2025 peak, completing a textbook descending triangle breakout on the daily chart. Two bull RSI divergences and a Change of Character (CHoCH) near $4,000 underpin the move. Managed money rose 10,971 contracts to 130,766 net long (75th percentile), while the first major resistance sits between $4,370 and $4,500.
- GBP/USD is pressing into a weak high near 1.35600 after rallying from the 1.33000 demand zone, but a bear RSI divergence is forming with price printing higher highs while RSI prints lower highs. Retail traders remain 67% short (contrarian bullish), though leveraged money shed 2,923 net contracts last week. Thursday’s UK GDP (forecast 0.1% contraction) is the key catalyst for cable.
- Wednesday’s US CPI is the marquee event, with headline inflation expected at 3.4% year on year (from 3.5%) and core CPI at 2.5% (from 2.6%). June’s 0.0% month on month core print was the softest in over a year. A continuation of that cooling trend would weaken the dollar and provide fuel for both gold’s breakout and cable’s push toward 1.3560.
Setting the Scene
Last week was a statement week for risk assets. The S&P 500 closed above 7,700 for the first time in history, the Dow punched through 54,000, and the Nikkei led the global charge with a 4.49% weekly gain. European indices joined the rally, with the DAX climbing 1.22% and the Euro Stoxx 50 adding 1.51%. But the most discussed chart sits in the metals market, where gold has broken out of the descending triangle that defined its structure since November 2025, rallying over 7% to $4,344.
The macro backdrop supports the move. June’s CPI showed core inflation printing a flat 0.0% month on month, the softest reading in over a year, while US GDP sits at 1.5% QoQ and unemployment at 4.1%. The market is pricing in a Fed reluctant to hike further if that cooling trend continues on Wednesday. Meanwhile, GBP/USD has quietly rallied from the 1.33000 demand zone to test 1.35000, with UK GDP on Thursday and a bear RSI divergence on the H4 chart creating a crossroads for cable. Oil remains a wildcard, with WTI at $78.83 and the Strait of Hormuz situation still unresolved.
Gold (XAU/USD): The Breakout Everyone Is Talking About
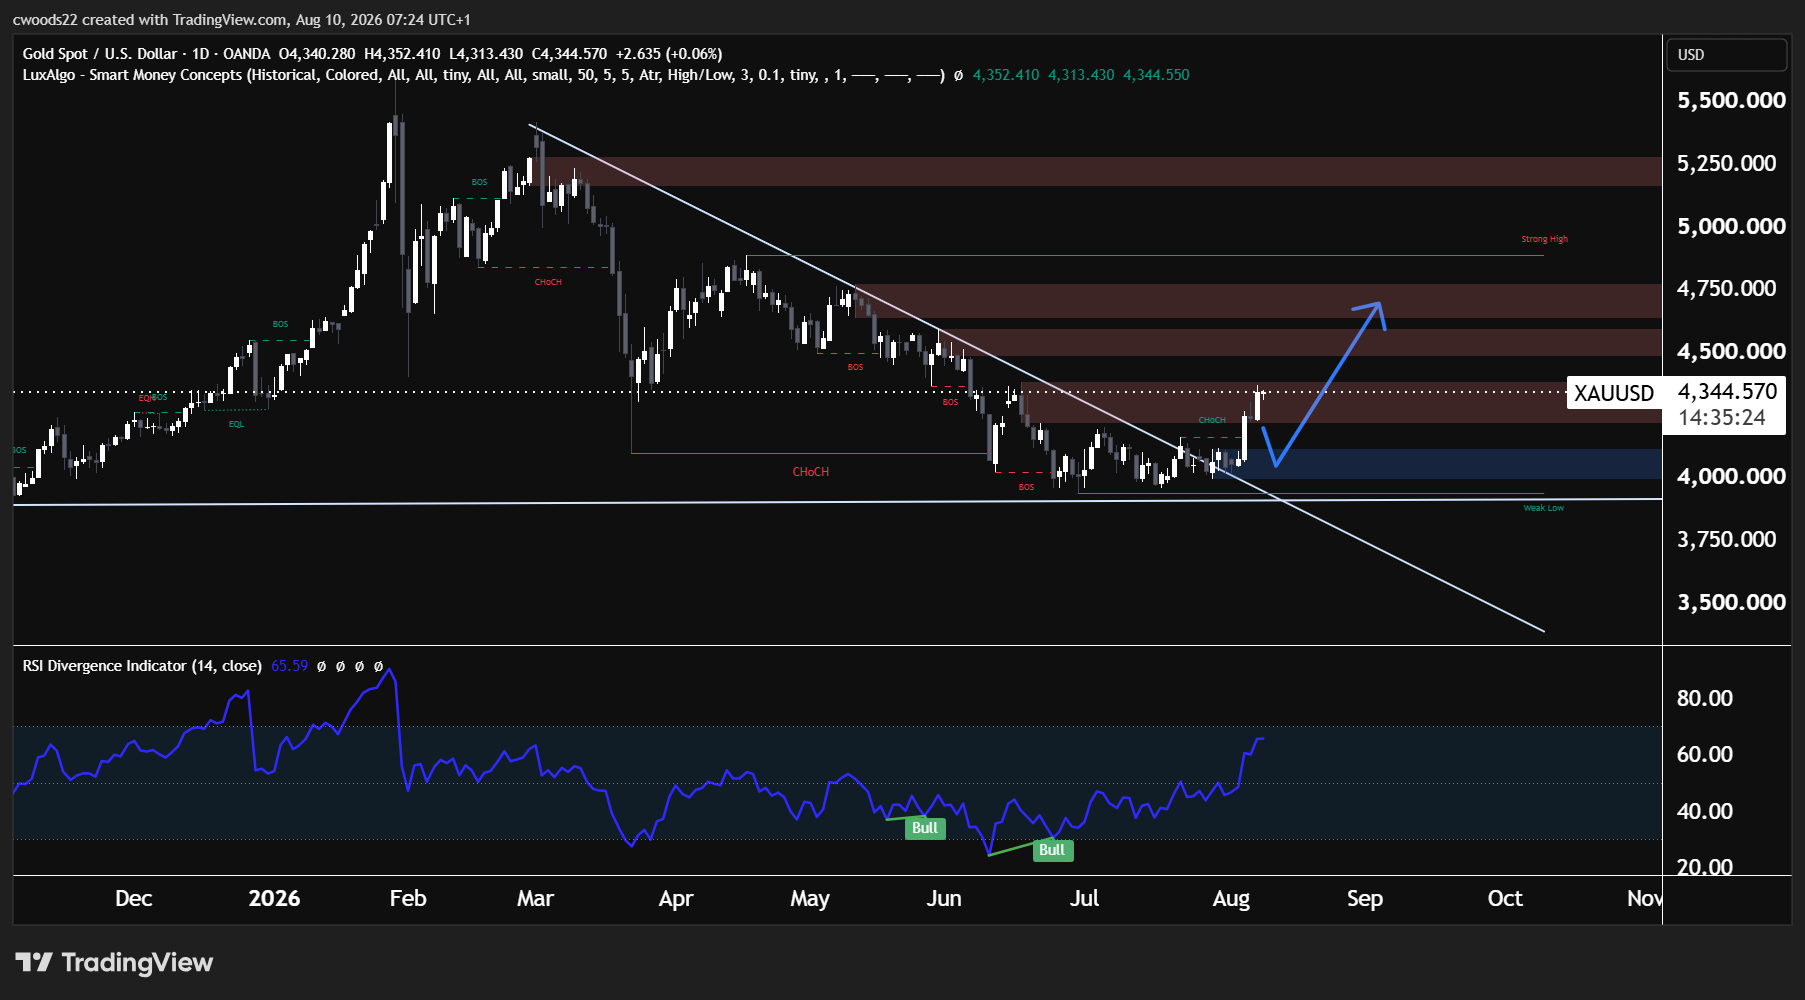
Chart: XAU/USD, Daily timeframe (TradingView, SMC)
Gold has been making lower highs since November 2025, respecting a descending trendline from the $5,500 peak through the $4,800 and $4,500 rejections. At the same time, buyers built a floor around $3,900 to $4,000, creating a textbook descending triangle. Two bull RSI divergences at the June and July lows signalled fading sell pressure, and a Change of Character (CHoCH) near $4,000 confirmed buyers stepping in with conviction.
The breakout above the trendline carried gold from $4,050 to $4,344 in days. RSI sits at 65.59, bullish but not overbought, suggesting room to run. Managed money rose 10,971 contracts to 130,766 net long (75th percentile of the 52 week range), driven by both new longs (+4,716) and short covering. Retail traders remain 57% short, which from a contrarian perspective adds further weight to the bullish case.
The first resistance zone sits between $4,370 and $4,500, where price stalled in April and May. A clean break through could open the door to $4,700 to $4,800, the measured move target from the full height of the triangle. On the downside, $4,085 must hold as the new floor. Wednesday’s CPI is the catalyst: soft inflation weakens the rate hike narrative and fuels the breakout, while a hot print puts $4,370 to $4,500 resistance firmly in play.
GBP/USD: Bear Divergence Meets the 1.3500 Ceiling
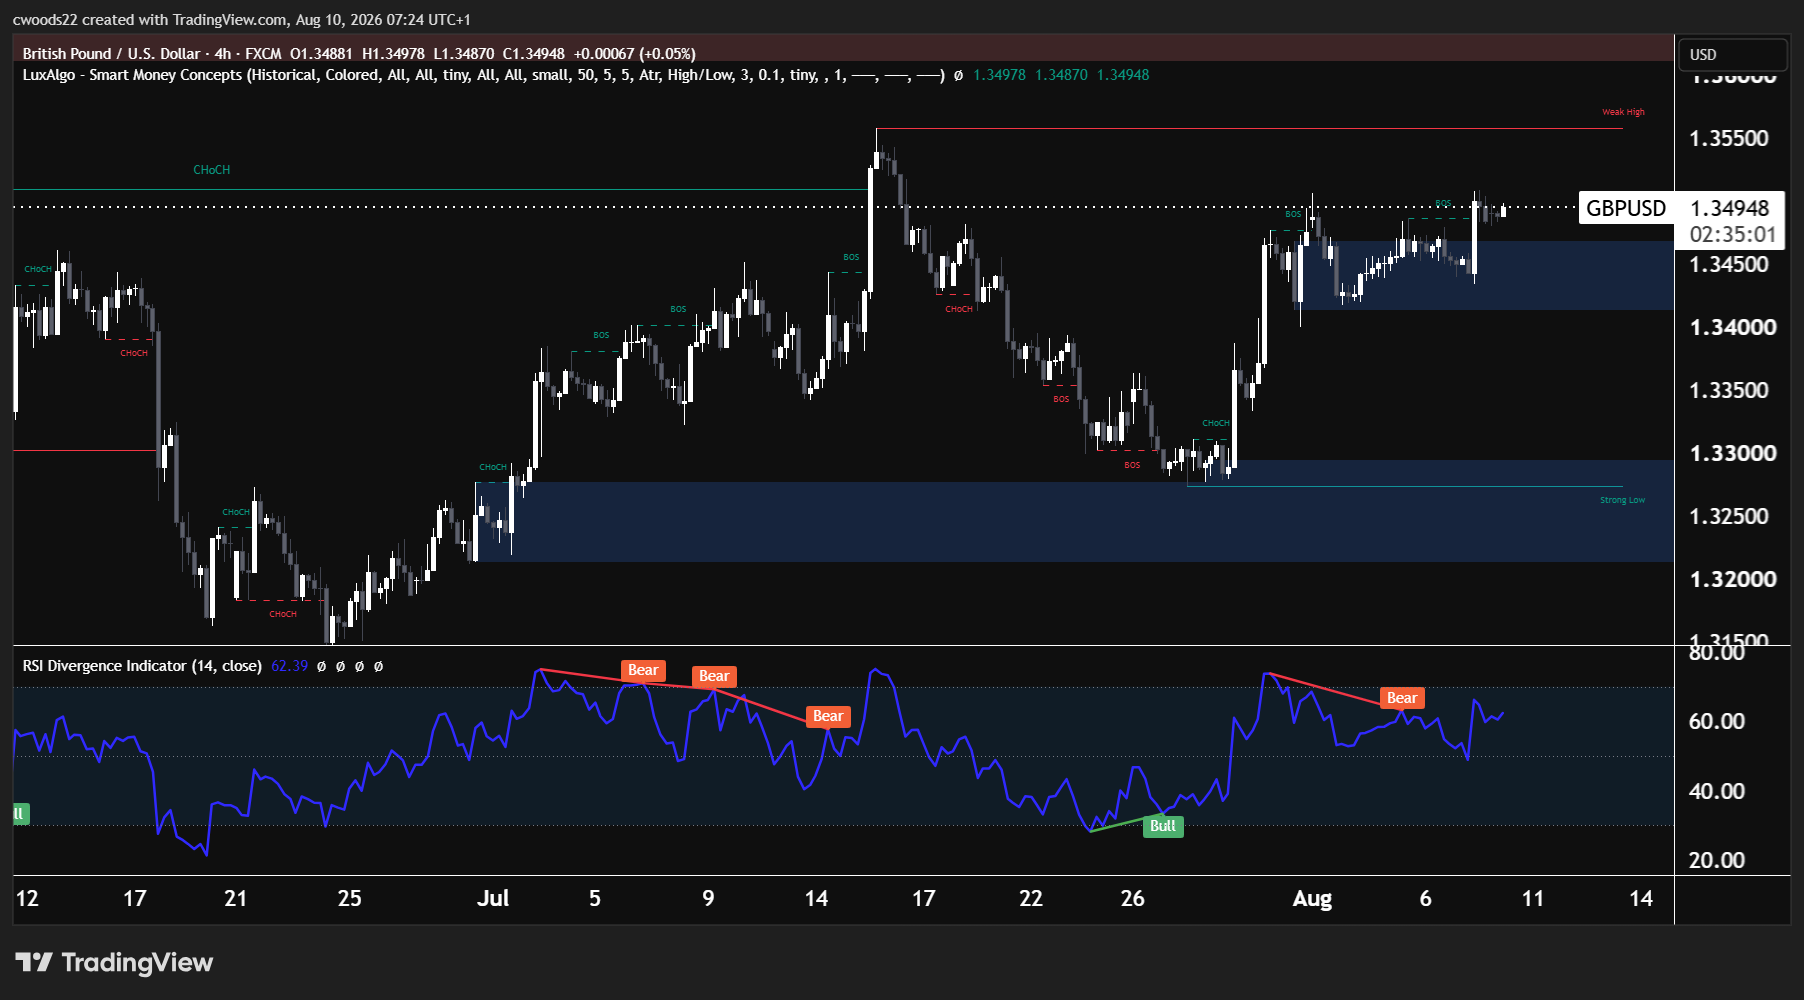
Chart: GBP/USD, H4 timeframe (TradingView, SMC)
Cable has rallied from the 1.33000 demand zone in late July to test the weak high near 1.35600, with multiple breaks of structure (BOS) confirming a bullish trend on the H4 chart. Price closed at 1.34948, right at the psychological 1.35000 level. The move has been clean and sustained, but the momentum picture is starting to flash caution.
A bear RSI divergence is forming at the highs, with price printing higher highs while RSI prints lower highs. Previous instances of this pattern in early and mid July preceded pullbacks of varying depth. RSI sits at 62.39, elevated but not extreme. The divergence does not guarantee a reversal, but it suggests momentum is fading as price approaches the most significant resistance on the chart. A clean break above 1.35600 would invalidate the weak high and open the door toward 1.36000, while rejection could see price retrace to the 1.34000 to 1.34200 demand zone where recent CHoCH and BOS levels converge.
Positioning is mixed. Leveraged money shed 2,923 net contracts last week (net +38,174, still 76th percentile), while 67% of retail traders are short, which from a contrarian standpoint supports further upside. Thursday’s UK GDP is the key catalyst, with consensus expecting a 0.1% month on month contraction. A weaker print could trigger a pullback, particularly if the bear divergence plays out at the same time. A stronger reading would give bulls the fuel to push through 1.35600 and establish a new structural high.
Key Events This Week
All times shown in UTC. High and medium impact events only.
| Day | Time (UTC) | Event | Forecast | Previous |
| Tue 11 Aug | 04:30 | RBA Cash Rate (AUD) | 4.35% | 4.35% |
| Tue 11 Aug | 04:30 | RBA Rate Statement (AUD) | — | — |
| Wed 12 Aug | 12:30 | Core CPI m/m (USD) | 0.2% | 0.0% |
| Wed 12 Aug | 12:30 | Core CPI y/y (USD) | 2.5% | 2.6% |
| Wed 12 Aug | 12:30 | CPI y/y (USD) | 3.4% | 3.5% |
| Thu 13 Aug | 06:00 | GDP m/m (GBP) | −0.1% | 0.1% |
| Thu 13 Aug | 06:00 | Prelim GDP q/q (GBP) | 0.4% | 0.6% |
| Thu 13 Aug | 12:30 | Core PPI m/m (USD) | 0.3% | 0.2% |
| Thu 13 Aug | 12:30 | PPI m/m (USD) | 0.2% | −0.3% |
| Thu 13 Aug | 12:30 | Unemployment Claims (USD) | 202K | 199K |
| Fri 14 Aug | 12:30 | Core Retail Sales m/m (USD) | 0.2% | −0.2% |
| Fri 14 Aug | 12:30 | Retail Sales m/m (USD) | 0.1% | 0.2% |
| Fri 14 Aug | 14:00 | UoM Consumer Sentiment (USD) | 54.4 | 54.4 |
The Bottom Line
Two charts, two stories, one catalyst. Gold’s triangle breakout is the technical event of the month, but patterns are only as good as the follow through. Wednesday’s CPI will determine whether the move has the fundamental backing to challenge $4,370 to $4,500. GBP/USD tells the opposite momentum story: a strong rally into 1.35000 resistance with a bear divergence warning that the push may be losing steam.
The thread connecting both setups is the same: the data decides. A soft CPI print strengthens gold, weakens the dollar, and gives cable room to break higher. A hot print tests gold’s breakout and gives the bear divergence on GBP/USD the catalyst it needs. Thursday’s UK GDP adds a second layer for cable traders. This is a week to let the numbers speak before committing to a direction.
Risk Warning: Trading financial instruments, particularly those involving leverage, involves a substantial degree of risk and is not appropriate for all investors. The value of your investments can rise or fall sharply, and it is possible to lose the entirety of your invested capital. Leveraged products, in particular, amplify both potential gains and losses. Before engaging in such trading, you must assess your financial goals, experience level, and appetite for risk. It is your sole responsibility to ensure that you understand the mechanics and risks of trading, including margin requirements, and to seek independent financial advice where appropriate. Do not trade with funds you cannot afford to lose. Nothing in this site should be read or construed as constituting advice on the part of Taurex or any of its affiliates, directors, officers or employees.