
Key Points
- The calendar is lighter this week after last week’s payrolls miss, with Wednesday’s FOMC Minutes and Friday’s Canadian jobs report the two main events to watch.
- Bitcoin is trading at 85,489.75, consolidating below the high near 87,000 after last month’s breakout from a multi-week range between 76,000 and 82,000.
- EUR/USD sits at 1.1178, holding just above last week’s low near 1.1150 after a sharp payrolls-day selloff broke down through a series of support zones from a high near 1.1700 in August.
Last Week in Review
The RBA delivered its fourth hike of the year on Tuesday, raising the cash rate by 25 basis points to 4.60 percent in a unanimous decision, the highest level since 2011. The framing was hawkish on the surface, but Governor Bullock’s press conference leaned more cautious, with the central bank signalling it wants to see how the current round of tightening works through the economy before moving again.
Friday’s September Non-Farm Payrolls report was the week’s dominant event, and it landed well short of expectations. The US economy added just 29,000 jobs against a forecast of 90,000, while August’s print was revised down sharply to 133,000 and the unemployment rate ticked up to 4.2 percent from 4.1 percent. Wage growth stayed soft, with average hourly earnings up 0.1 percent on the month and 3.0 percent year on year. The miss reopened the debate on how much further the Fed’s tightening cycle has to run, and risk assets whipsawed through the session as markets repriced that path.
The dollar’s reaction was not straightforward. Despite the weak print typically arguing for a softer dollar, broad risk-off flows tied to the growth scare sent the greenback bid into the weekend, extending EUR/USD’s decline rather than reversing it. That dynamic carries directly into this week.
Bitcoin: Consolidating Below the High Near 87,000
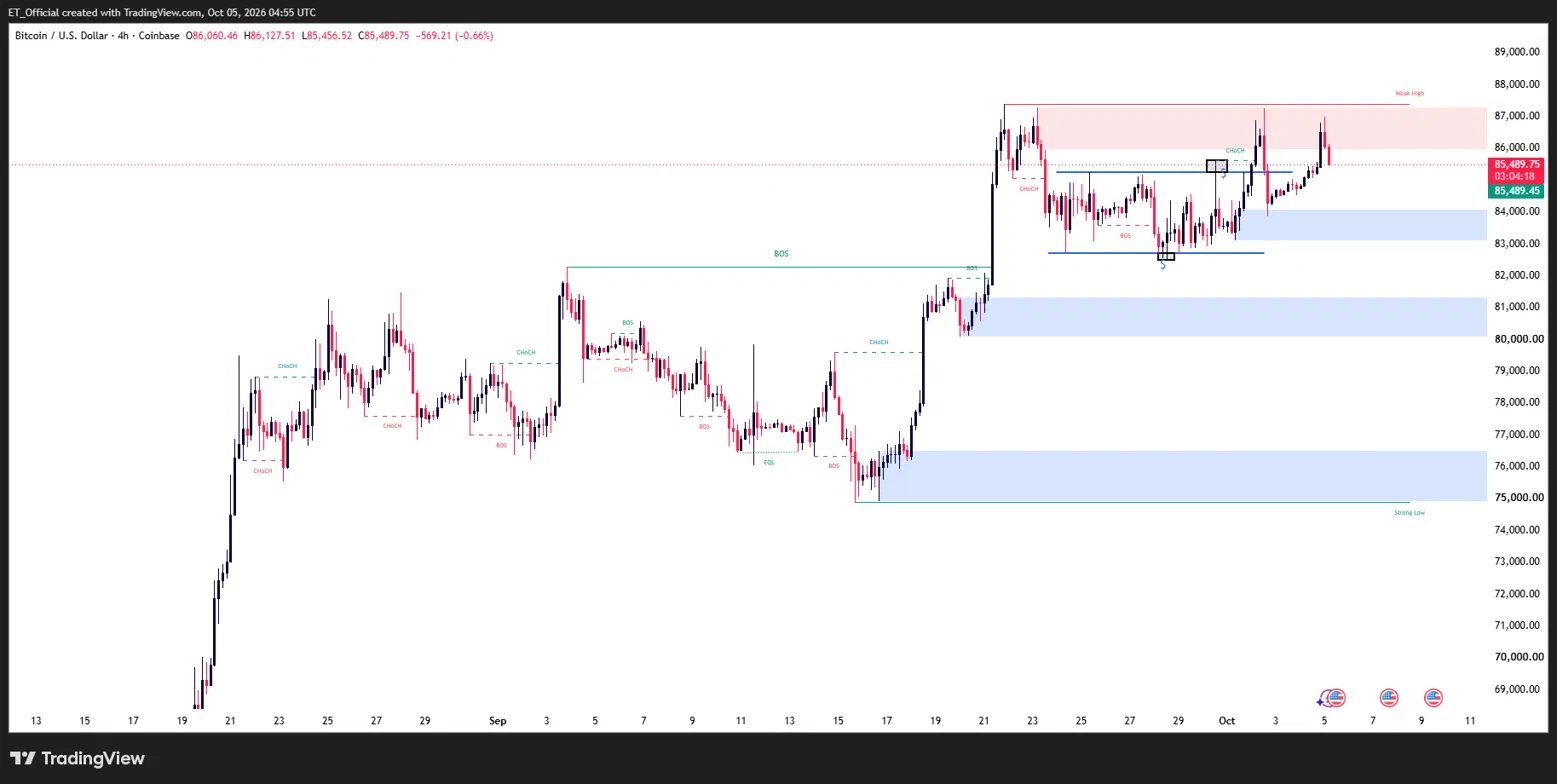
Chart: Bitcoin/USD, 4H timeframe (TradingView, SMC)
Bitcoin/USD 4H chart, 13 August to 5 October 2026: price broke out from a choppy 76,000 to 82,000 range in late September to a high near 87,000, and is now consolidating around 85,489 after pulling back from that high.
The 4H chart shows Bitcoin spent most of August and early September chopping between 76,000 and 82,000, with repeated breaks of structure and changes of character in both directions failing to resolve the range. That resolved decisively in the second half of September, with a sharp break of structure through 82,000 carrying price to a high near 87,000.
Since that high, Bitcoin has pulled back and consolidated through a change of character into the 83,000 to 86,000 region, dipping to test the 83,000 to 84,000 zone before recovering into this week to its current level of 85,489.75, just below Friday’s intraday high of 86,127.51.
Overhead, the high near 87,000 is the level to reclaim for a continuation of the breakout. Below current price, the 83,000 to 84,000 zone is the first support to hold, with the 80,000 to 81,000 zone and the 75,000 to 76,000 low further out if the pullback deepens. Tuesday’s roughly 856 million dollar Hyperliquid token unlock, the largest of the month, is worth watching for any knock-on effect on broader crypto liquidity and risk appetite this week.
EUR/USD: Holding the Line After the Payrolls-Day Break
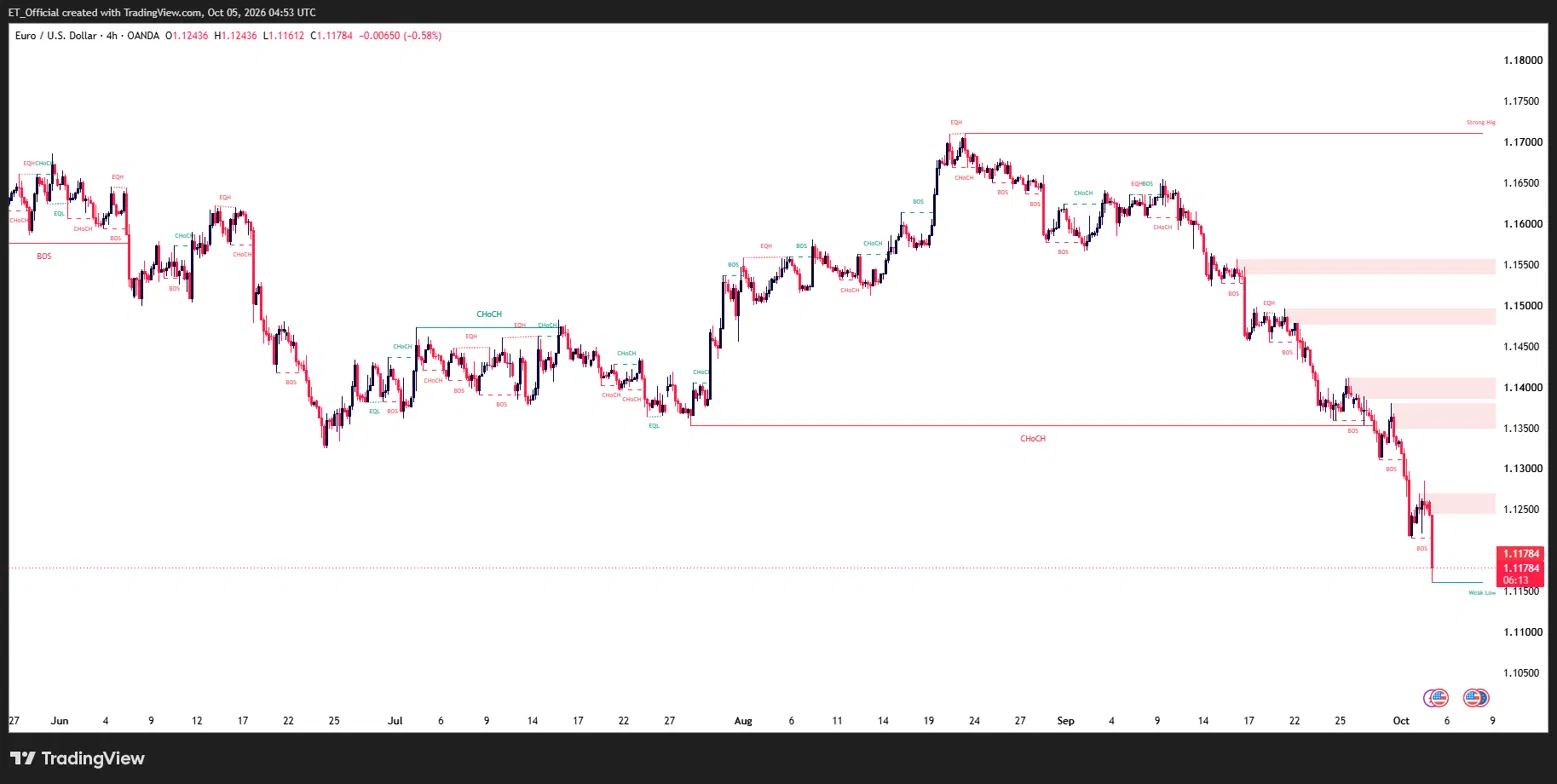
Chart: EUR/USD, 4H timeframe (TradingView, SMC)
EUR/USD 4H chart, 27 May to 5 October 2026: price rallied to a high near 1.1700 in mid-August before reversing into a sustained downtrend, breaking down sharply around the September jobs report to a low near 1.1150, now consolidating at 1.1178.
The 4H chart shows EUR/USD topping out near 1.1700 in mid-August before turning into a sustained downtrend, with a series of breaks of structure and changes of character carrying price steadily lower through September. The decline accelerated sharply around Friday’s payrolls release, breaking down through the 1.1350 to 1.1400 zone to a fresh low near 1.1150.
Price has since stabilised just above that low, consolidating at its current level of 1.1178 as the market digests both the weak US data and the broader risk-off dollar bid that followed it.
Overhead, the broken 1.1250 to 1.1300 zone is the first resistance to reclaim, with the deeper 1.1350 to 1.1400 region the larger ceiling above that. Below current price, the 1.1150 low is the level being defended; a clean break lower would open the door toward 1.1100 with little clear structure in between. Wednesday’s FOMC Minutes are the key event risk for the pair this week, offering the first detailed look at how the Fed characterised policy risks heading into the payrolls miss.
Key Events This Week
Monday 5 October US ISM Services PMI
The week opens with the ISM Services PMI for September, the first broad read on how the services side of the economy is holding up in the wake of Friday’s weak payrolls print, with consensus sitting near 55.
Tuesday 6 October Crude Inventories and a Large Crypto Unlock
EIA Crude Oil Inventories print for the week ending 2 October. In crypto, a roughly 856 million dollar Hyperliquid (HYPE) token unlock, the largest release of the month, is one to watch for its effect on broader digital asset liquidity.
Wednesday 7 October FOMC Minutes
The Federal Reserve releases minutes from the 15 to 16 September meeting. Published before Friday’s payrolls miss, the market will be reading them for any hints of internal disagreement over how much further the tightening cycle should run.
Thursday 8 October Q3 Earnings Season Opens
Earnings season kicks off with PepsiCo and Delta Air Lines among the first major names to report, offering an early read on consumer and travel demand heading into the final quarter of the year.
Friday 9 October Canadian Jobs Report and US Consumer Sentiment
Canada’s September jobs report is the week’s other major data point, the first full month of data following the US Section 338 tariffs. The University of Michigan Consumer Sentiment survey also prints, with the index tracking near multi-year lows around 48.
Risk Warning: Trading financial instruments, particularly those involving leverage, involves a substantial degree of risk and is not appropriate for all investors. The value of your investments can rise or fall sharply, and it is possible to lose the entirety of your invested capital. Do not trade with funds you cannot afford to lose. Nothing in this site should be read or construed as constituting advice on the part of Taurex or any of its affiliates, directors, officers or employees.