
Key Points
- A split tape today: NVIDIA pushes to fresh record highs on a historic buyback and AI optimism, while gold tests a major support zone under pressure from elevated yields, and oil holds a tight range as the Hormuz risk premium meets a bearish near-term structure.
- WTI crude is trading at $89.10, consolidating between $87.50 and $89.50 below the broken $91.50 to $93 zone, which is now being watched as resistance.
- Gold is trading at $4,122.94, testing the $4,100 to $4,120 zone directly after a month-long decline from a high near $4,400, with elevated Treasury yields keeping the pressure on.
- NVIDIA is trading at $239.11, just below an overnight record high near $239.60, after a sharp recovery from the $208 to $212 zone on the back of a $150 billion buyback authorisation.
WTI Crude Oil: Holding the Range Ahead of Wednesday’s Inventory Data
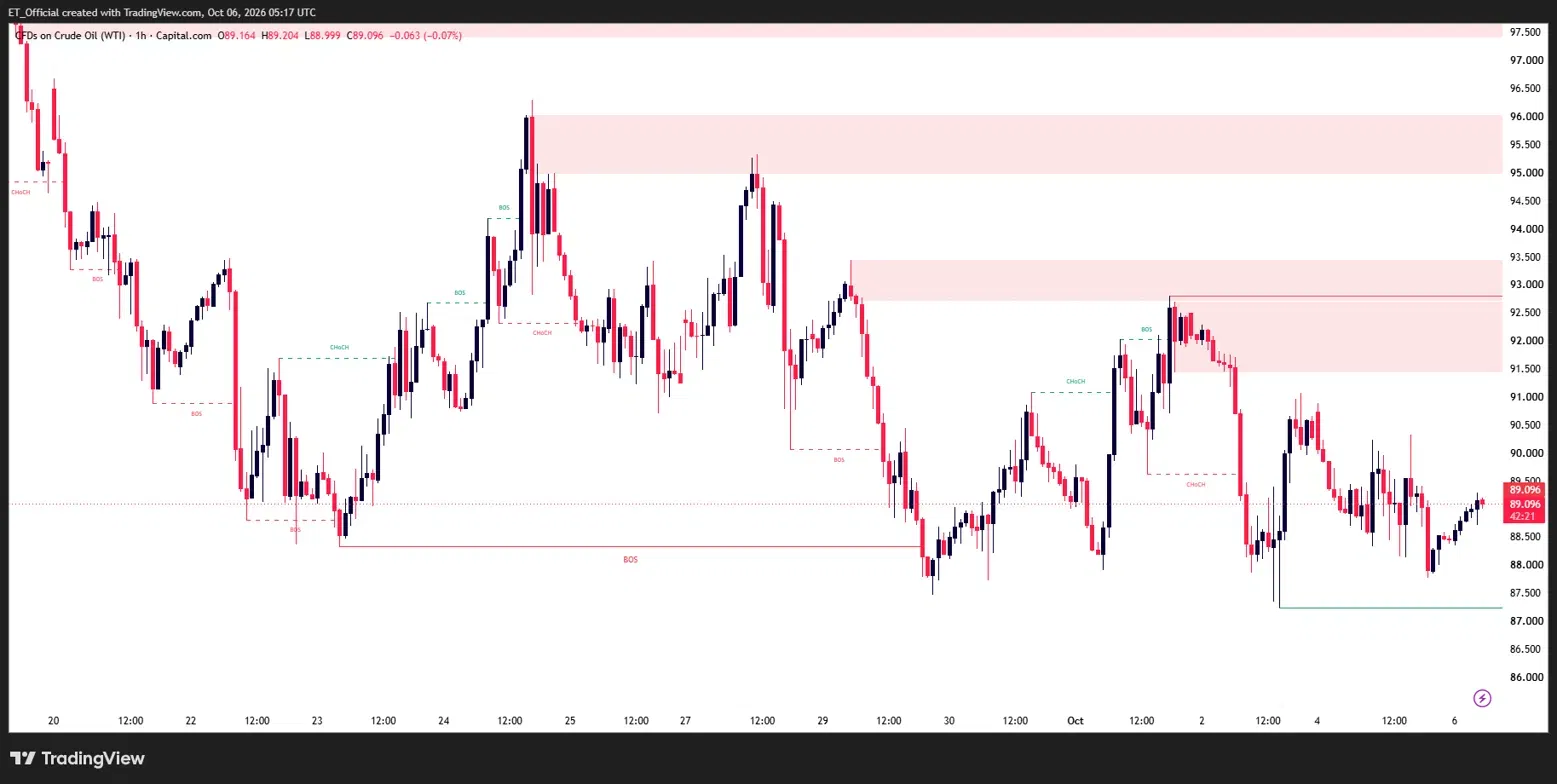
Chart: WTI Crude Oil, H1 timeframe (TradingView, SMC)
WTI Crude Oil H1 chart, 20 September to 6 October 2026: price broke down from a high near $96 to a low near $87, and is now consolidating at $89.10 below the broken $91.50 to $93 zone.
WTI’s H1 chart shows price consolidating in a tight band between $87.50 and $89.50 after last week’s clean break of structure through the $93 support zone, which carried the market to a fresh low near $87 before this recovery. Price is currently at $89.10, just below the broken $91.50 to $93 zone that is now being watched as resistance.
The $89.50 to $90 zone, where the most recent change of character was marked, is the level to watch on any push higher. A reclaim there would open the door toward retesting the $91.50 to $93 supply zone, while continued rejection would keep the broader structure pointed back toward the $87.50 low.
The backdrop remains the closure of the Strait of Hormuz, with Barclays flagging firmly skewed-higher risk to its $100 Brent forecast for 2026 given the fastest pace of global inventory draws on record. Wednesday’s EIA inventory data, alongside the FOMC Minutes, is the next scheduled catalyst for oil.
Gold: Testing a Major Support Zone
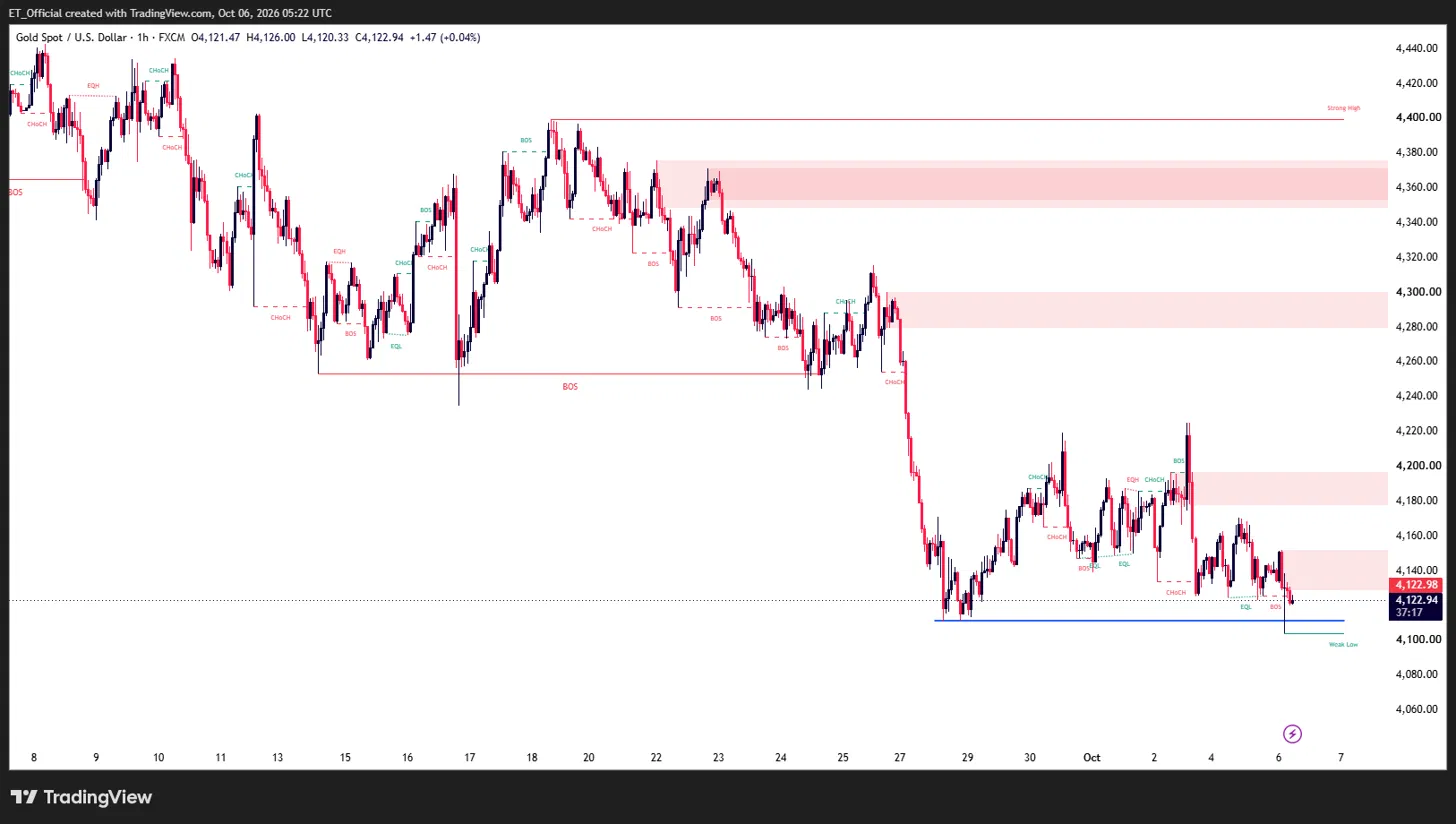
Chart: Gold (XAU/USD), H1 timeframe (TradingView, SMC)
Gold (XAU/USD) H1 chart, 8 September to 6 October 2026: price fell from a high near $4,400 to a fresh low testing the $4,100 to $4,120 zone, now trading at $4,122.94.
Gold’s H1 chart shows price grinding lower through the past month, breaking a sequence of support zones from a high near $4,400 in mid-September down to the current level of $4,122.94, now testing the $4,100 to $4,120 zone directly.
This zone is the level to watch for how price reacts on this test. A hold here would open scope for a recovery back toward the $4,140 to $4,160 zone above, while a clean break lower would expose the psychological $4,100 level and open the door toward further downside.
The driver remains Treasury yields sitting near their highest levels since 2007, which continues to raise the opportunity cost of holding a non-yielding asset like gold. With that yield backdrop showing no clear signs of reversing, it remains the key factor to monitor for gold’s next directional move.
NVIDIA: Extending to Fresh Record Highs
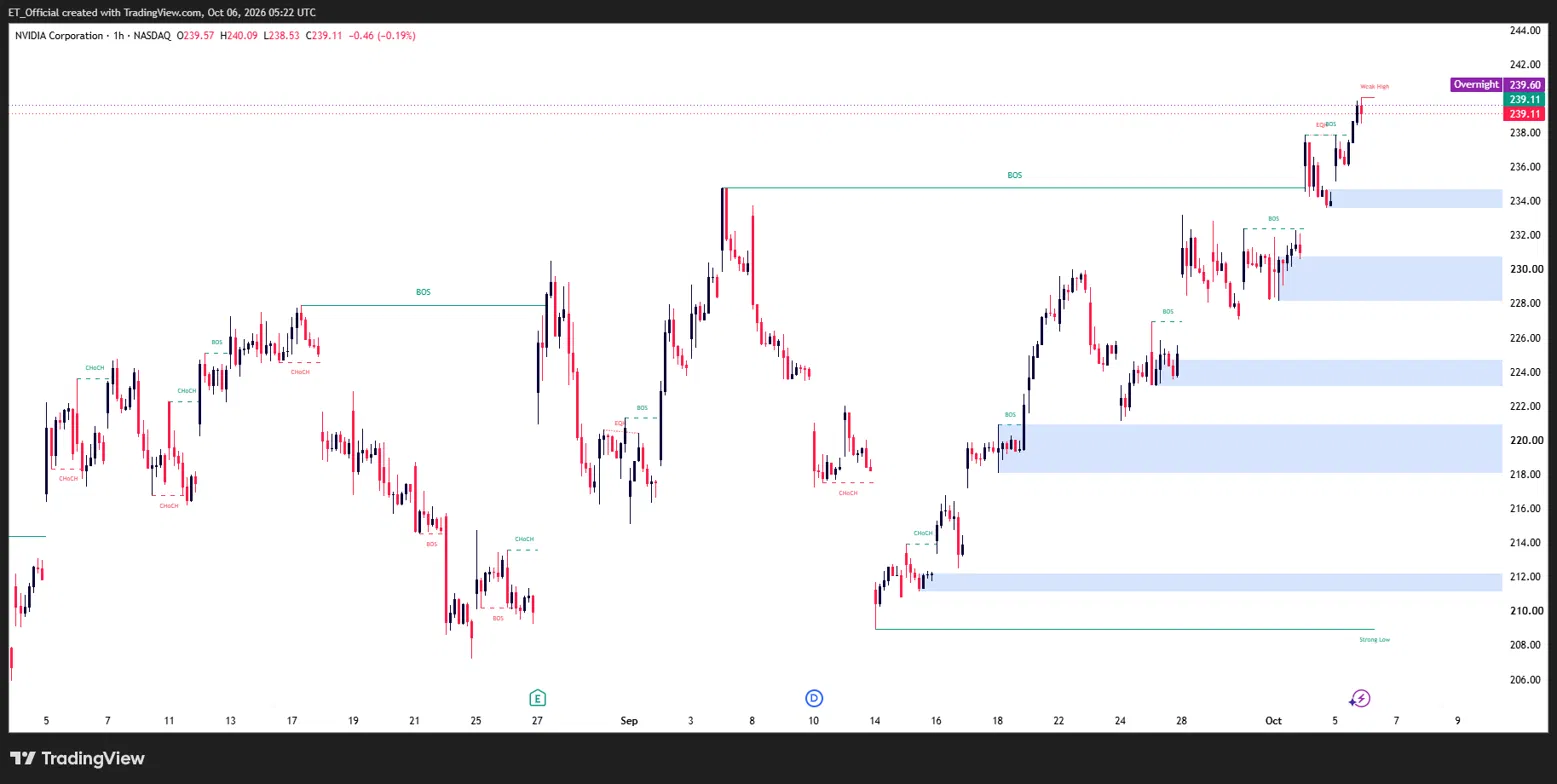
Chart: NVIDIA (NVDA), H1 timeframe (TradingView, SMC)
NVIDIA (NVDA) H1 chart, 5 September to 6 October 2026: price recovered from the $208 to $212 zone to a fresh record high near $239.60 overnight, now trading at $239.11.
NVIDIA’s H1 chart shows a powerful recovery from the $208 to $212 demand zone in late September, with a sequence of breaks of structure carrying price to a fresh record high near $239.60 overnight, before a modest pullback to the current level of $239.11.
The $234 to $236 zone, the most recent break of structure level, is the area to watch on any retracement. A hold above it would keep the uptrend structure intact toward a retest of the overnight high, while a break back below it would be the first sign of near-term exhaustion.
The move follows Nvidia’s board approving an additional $150 billion in share buybacks, the largest such authorisation in corporate history, alongside Morgan Stanley reinstating the stock as its top semiconductor pick on continued AI infrastructure demand. That combination of buyback support and AI optimism remains the key driver behind the stock’s push to fresh highs.
Risk Warning: Trading financial instruments, particularly those involving leverage, involves a substantial degree of risk and is not appropriate for all investors. The value of your investments can rise or fall sharply, and it is possible to lose the entirety of your invested capital. Leveraged products, in particular, amplify both potential gains and losses. Before engaging in such trading, you must assess your financial goals, experience level, and appetite for risk. It is your sole responsibility to ensure that you understand the mechanics and risks of trading, including margin requirements, and to seek independent financial advice where appropriate. Do not trade with funds you cannot afford to lose. Nothing in this article constitutes financial advice or a personal recommendation, and nothing in this site should be read or construed as constituting advice on the part of Taurex or any of its affiliates, directors, officers or employees. All levels referenced are for educational and illustrative purposes only.