
U.S. stock indices closed lower yesterday, as the S&P 500 declined by 0.63%, the Nasdaq 100 fell by 0.42%, and the Dow Jones dropped by 0.39%.
Meanwhile, the volatility index VIX rose to 20.85 points yesterday, its highest level since April 13, 2026, reflecting increased anxiety among investors in U.S. equities.
It is worth noting that both the Nasdaq 100 and Russell 2000 indices recorded new all-time highs yesterday before closing the session in negative territory.
In this context, three key developments can be observed:
The Philadelphia Semiconductor Index reached a new record high yesterday, rising for the fifteenth consecutive session and gaining around 36% since the beginning of the year, reflecting strong optimism surrounding investments in the semiconductor and artificial intelligence sectors.
The Russell 2000 index, which includes small and mid-cap stocks, has also outperformed other U.S. indices by roughly 12%, indicating a rotation within investment portfolios.
In addition, the S&P 500 Equal Weight Index outperformed the traditional S&P 500 by about 6%, signaling broader market participation and stronger internal market breadth.
Furthermore, when analyzing the annual performance of the S&P 500 sector, seven sectors recorded gains while four sectors declined. The energy sector led the advances, rising by approximately 25%.
Expectations point to the continuation of positive momentum in U.S. equities in the coming period despite elevated valuations. This outlook is supported by several factors, most notably the strong performance of the U.S. economy. For example, retail sales in March exceeded analysts’ expectations, in addition to solid earnings results reported by most U.S. companies for the first quarter of the year so far.
However, despite this strong optimism, U.S. equity markets currently face several risks. These include ongoing geopolitical tensions, the closure of the Strait of Hormuz, inflation concerns, and fiscal risks. Increased military spending in the United States may place additional pressure on public finances, which are already facing a fiscal deficit, potentially leading to a further widening of that deficit. Indeed, we have already seen a broad rise in U.S. Treasury yields across different maturities, particularly the 30-year Treasury yield, which is the most sensitive to fiscal policy developments.
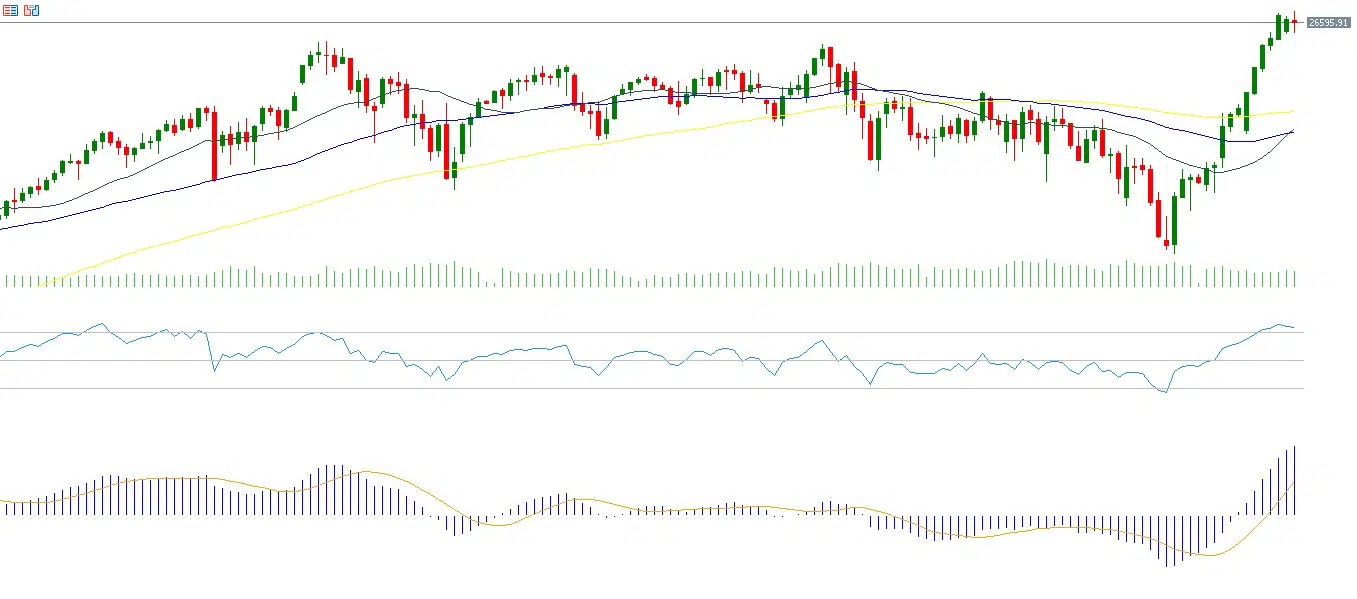
From a technical perspective, the Nasdaq 100 reached a record high of 26,730 points before closing at 26,479 points. The Relative Strength Index currently stands at 70, indicating overbought conditions and strong upward momentum. In addition, a bullish crossover has appeared between the MACD line and the signal line, supporting the continuation of positive momentum. Moreover, a bullish or golden crossover has occurred between the 20-day moving average and the 50-day moving average, which may signal further upside potential.
Please note that this analysis is provided for informational purposes only and should not be considered as investment advice. All trading involves risk.


