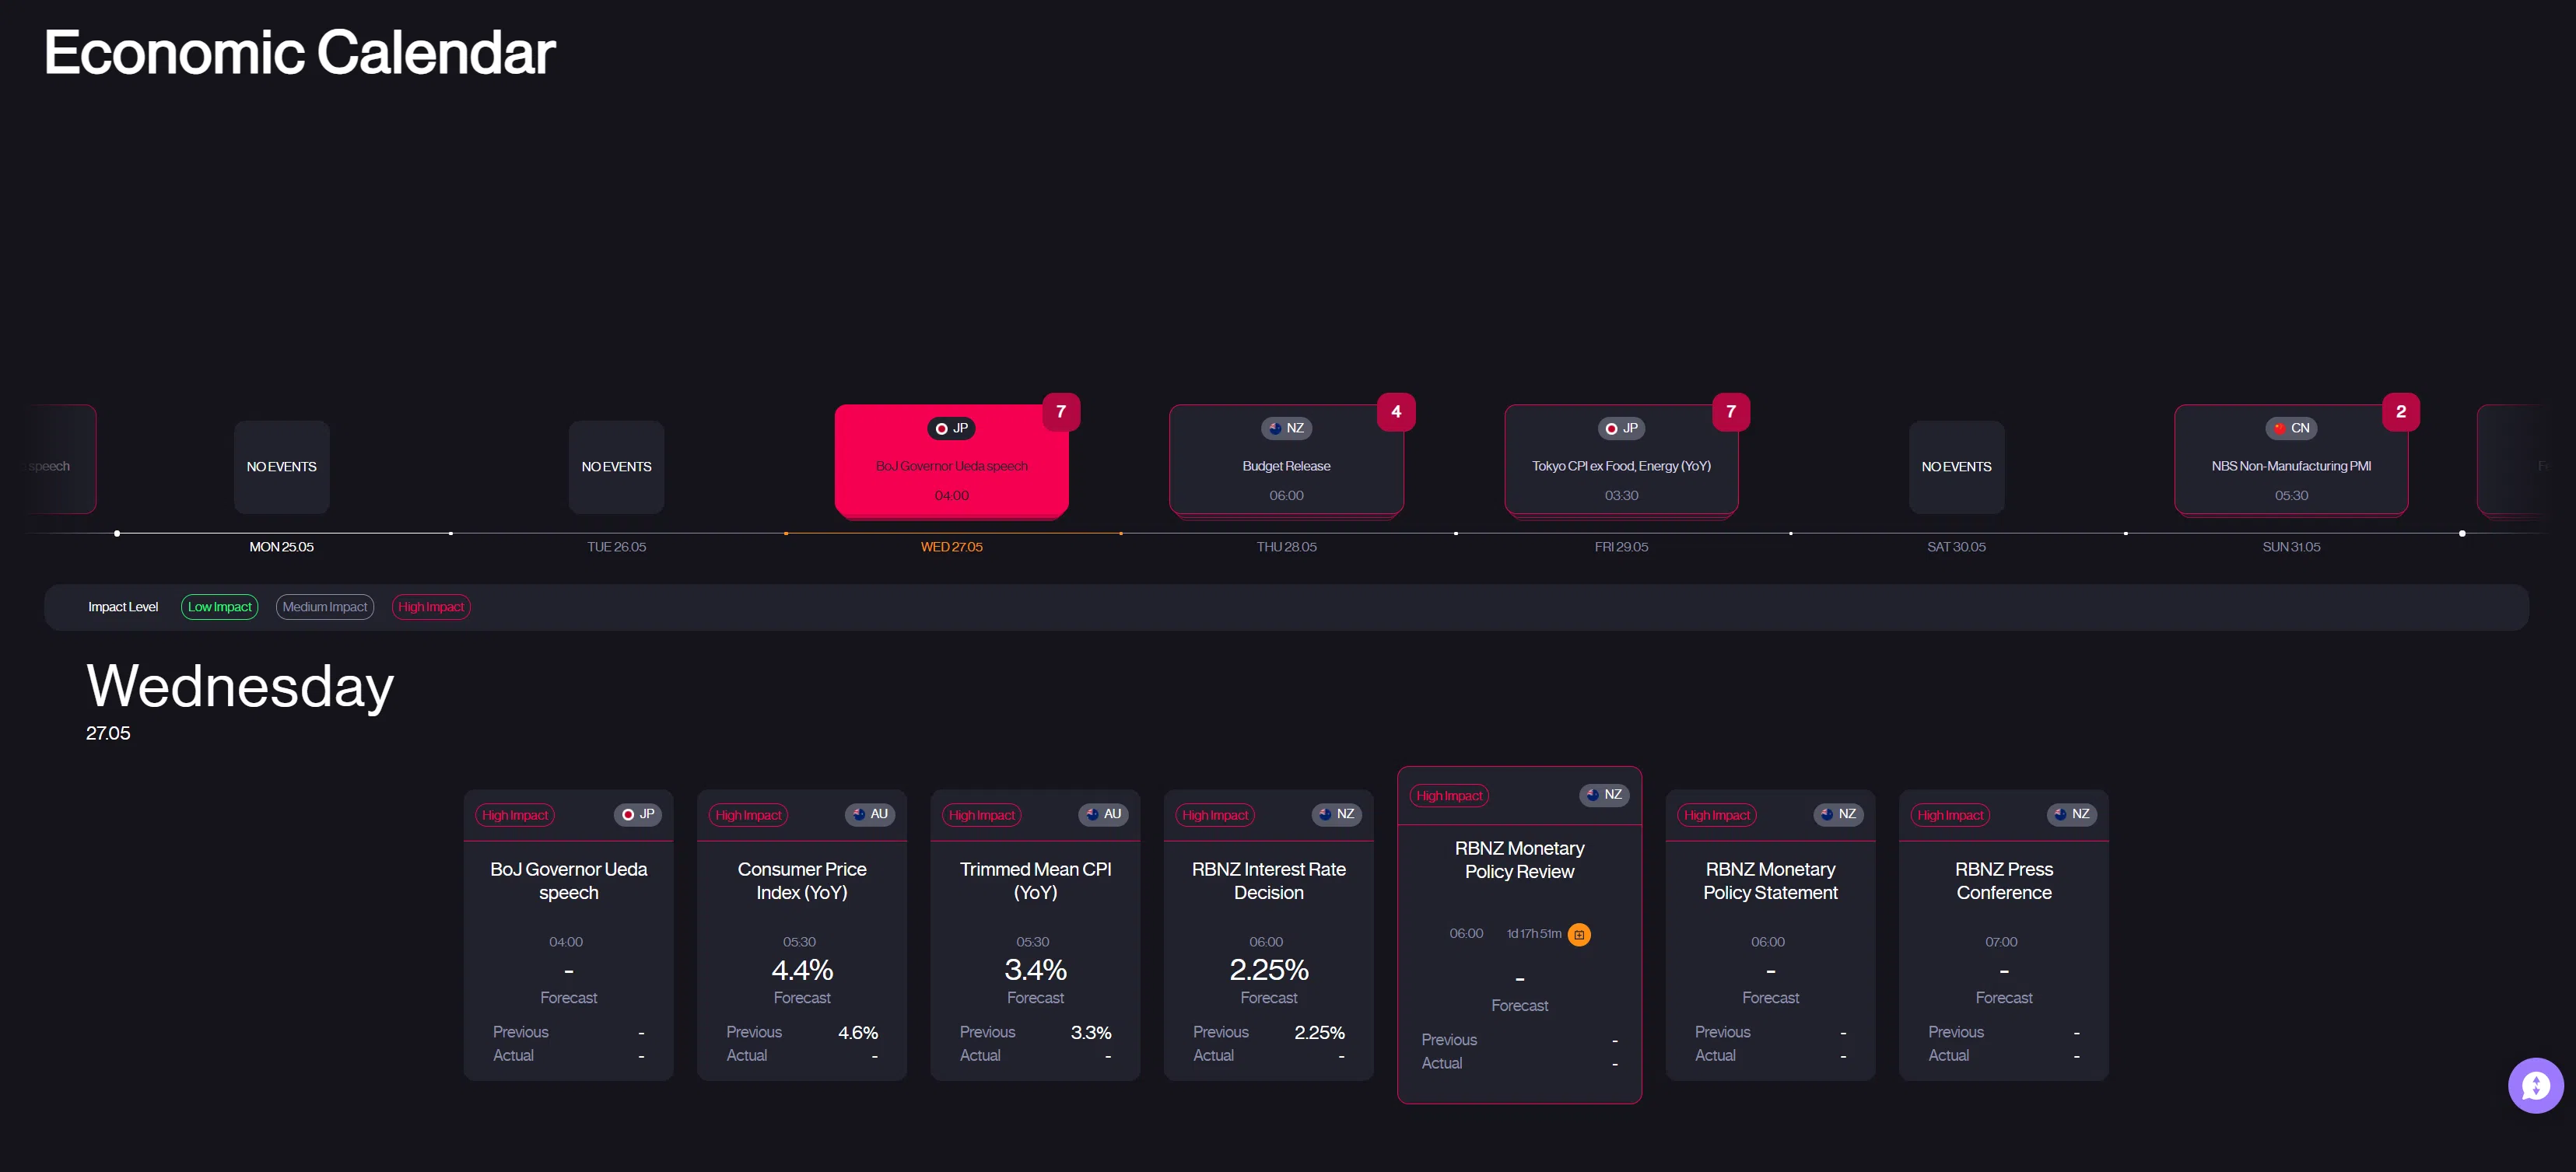
Key Points
- Wednesday delivers a central bank double header that will directly impact AUD/NZD: Australian CPI data drops at 01:30 UTC (headline forecast 4.4%, down from 4.6%) followed by the RBNZ interest rate decision at 02:00 UTC, where markets are pricing a 75% chance of a hold at 2.25% and a 25% chance of a surprise hike.
- Thursday brings the heavyweight US data: the Q1 GDP second estimate (forecast revised up to 2.0% from the preliminary 0.5%), Core PCE (the Fed’s preferred inflation gauge), and Durable Goods Orders. These will shape rate hike expectations and drive gold into the weekend.
- Last week’s FOMC minutes confirmed growing hawkish pressure inside the Fed, with markets now pricing a 100% probability of a rate hike by December 2026. US manufacturing PMI surged to 55.3, the highest since May 2022, while factory input prices spiked to 79.5, signalling that inflation is far from contained.
The Macro Picture
Last week reinforced the message: this is a hawkish environment and it is getting more hawkish, not less. The FOMC minutes from the April 28 to 29 meeting revealed a committee that is not just holding rates, it is actively debating whether to raise them. The internal divide that produced the 8 to 4 split under Powell has not healed under Warsh, and the minutes showed several members arguing that the oil driven inflation surge requires a policy response. Markets have taken the hint. Fed funds futures now price a 100% probability of at least one rate hike by December 2026, up from 62% the week before.
The economic data backed up the hawkish case. The S&P Global US Manufacturing PMI jumped to 55.3 in May from 54.5, the highest reading since May 2022. More concerning was the prices paid component, which surged to 79.5 from 68.4, the highest since June 2022. That tells us factories are paying significantly more for raw materials and are likely to pass those costs on to consumers in the coming months.
Nvidia delivered a record breaking quarter with $81.6 billion in revenue and guided for $91 billion next quarter, helping the S&P 500 extend its winning streak to eight consecutive weeks and push to fresh all time highs. The reaction to the earnings beat was muted compared to previous quarters, but the broader trend is undeniable: equities continue to grind higher despite every reason the macro backdrop is giving them to sell off. That resilience is worth paying attention to.
Gold fell for a second consecutive week, closing near $4,520. The combination of rising rate hike expectations, a strong dollar, and the 30 year yield holding above 5% continues to weigh on the metal. But the Strait of Hormuz conflict and central bank accumulation provide a floor, and the H4 chart is showing a tightening compression pattern that suggests a big move is building.
Gold: The Wedge Is Tightening
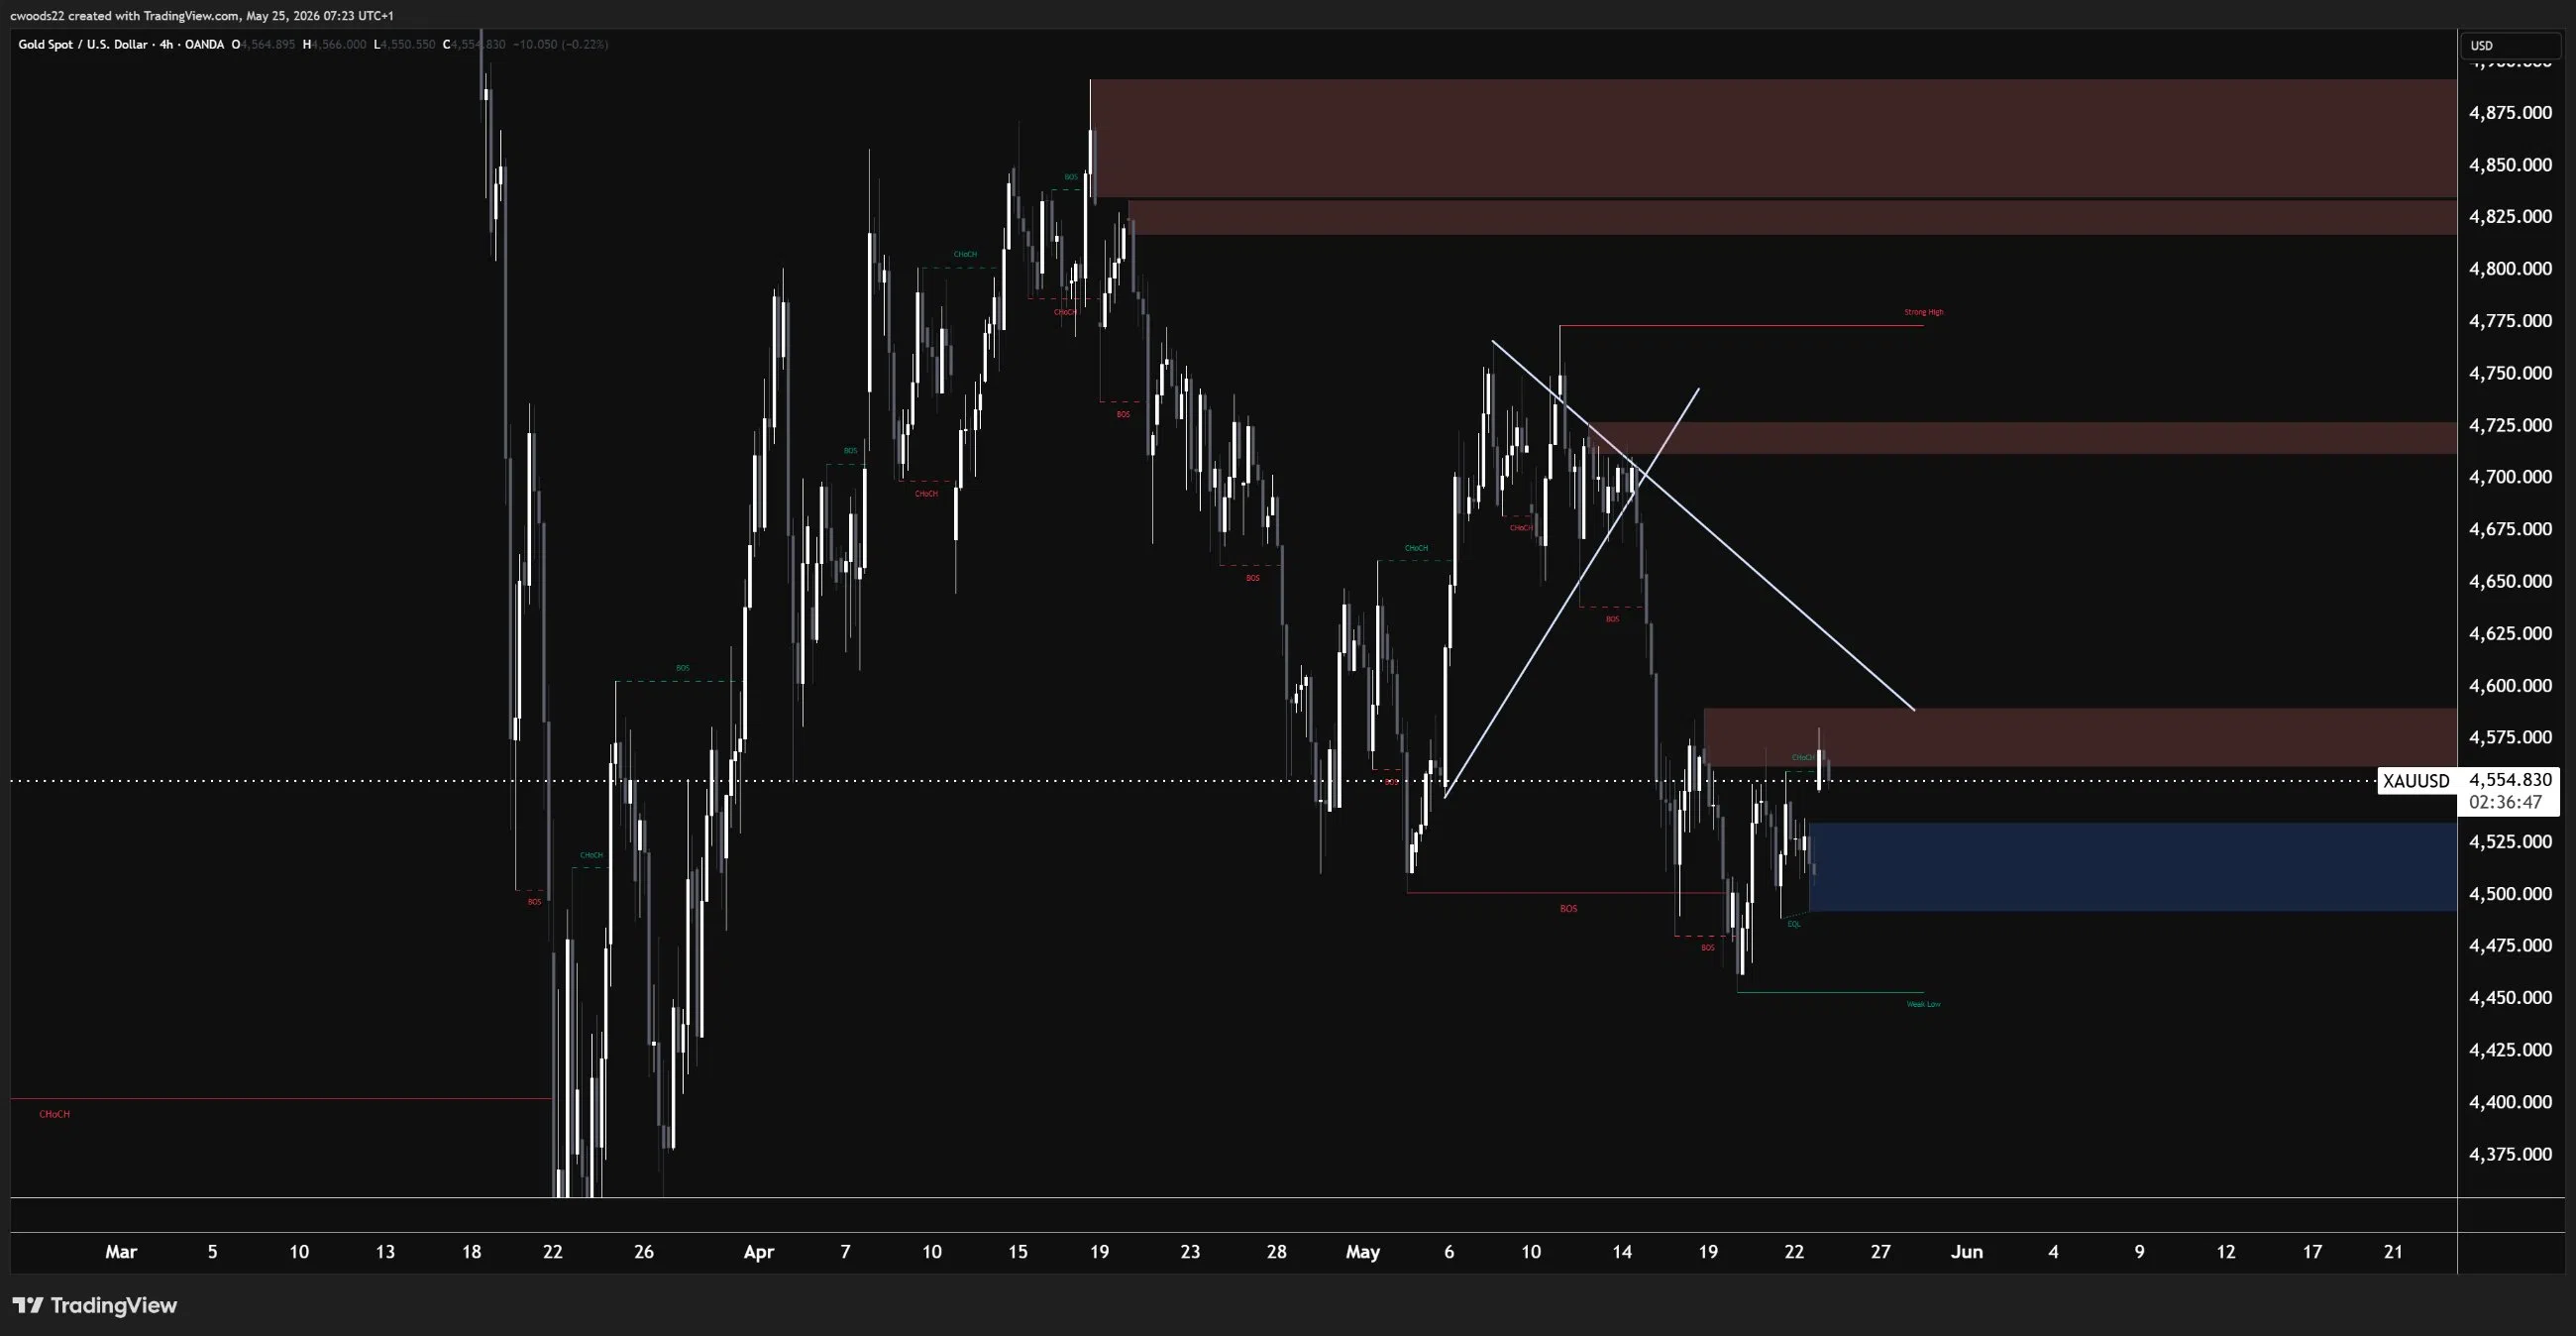
Gold at $4,554 is caught in a tightening wedge on the H4 chart and the breakout this week will likely define the next $100+ move. The descending trendline from the April highs has been compressing against a rising support line, and the two are now converging right around current price. This is a classic decision point where volatility is about to expand.
On the supply side, there are three clearly defined zones to watch. The nearest resistance sits at $4,575 to $4,600, which has capped every rally attempt over the past week. Above that, the $4,625 to $4,675 zone is where sellers have been stepping in more aggressively, and it aligns with the area where multiple CHoCH (Change of Character) signals formed during the April distribution. The major supply zone remains at $4,750 to $4,775, labelled as the Strong High on the chart. Reclaiming that level would shift the entire bearish structure, but it looks out of reach this week.
On the demand side, the $4,490 to $4,525 zone has been holding as near term support, with buyers stepping in on each test. Below that, the $4,440 to $4,460 area is marked as a Weak Low, meaning the market views it as vulnerable to a liquidity sweep. If gold breaks below the wedge, a sweep of the Weak Low toward $4,440 is the likely scenario before any bounce.
Thursday is gold’s day. The Core PCE print at 12:30 UTC will tell us whether the Fed’s preferred inflation measure is accelerating alongside the headline CPI data. If Core PCE comes in above 0.3% month on month, it would add fuel to the rate hike narrative and likely push gold below the wedge. The Q1 GDP second estimate is also critical: if it gets revised up from 0.5% to 2.0% as expected, it signals a resilient economy that can handle higher rates, which is bearish for gold. A downside surprise on either number could trigger the breakout higher.
AUD/NZD: The Central Bank Showdown
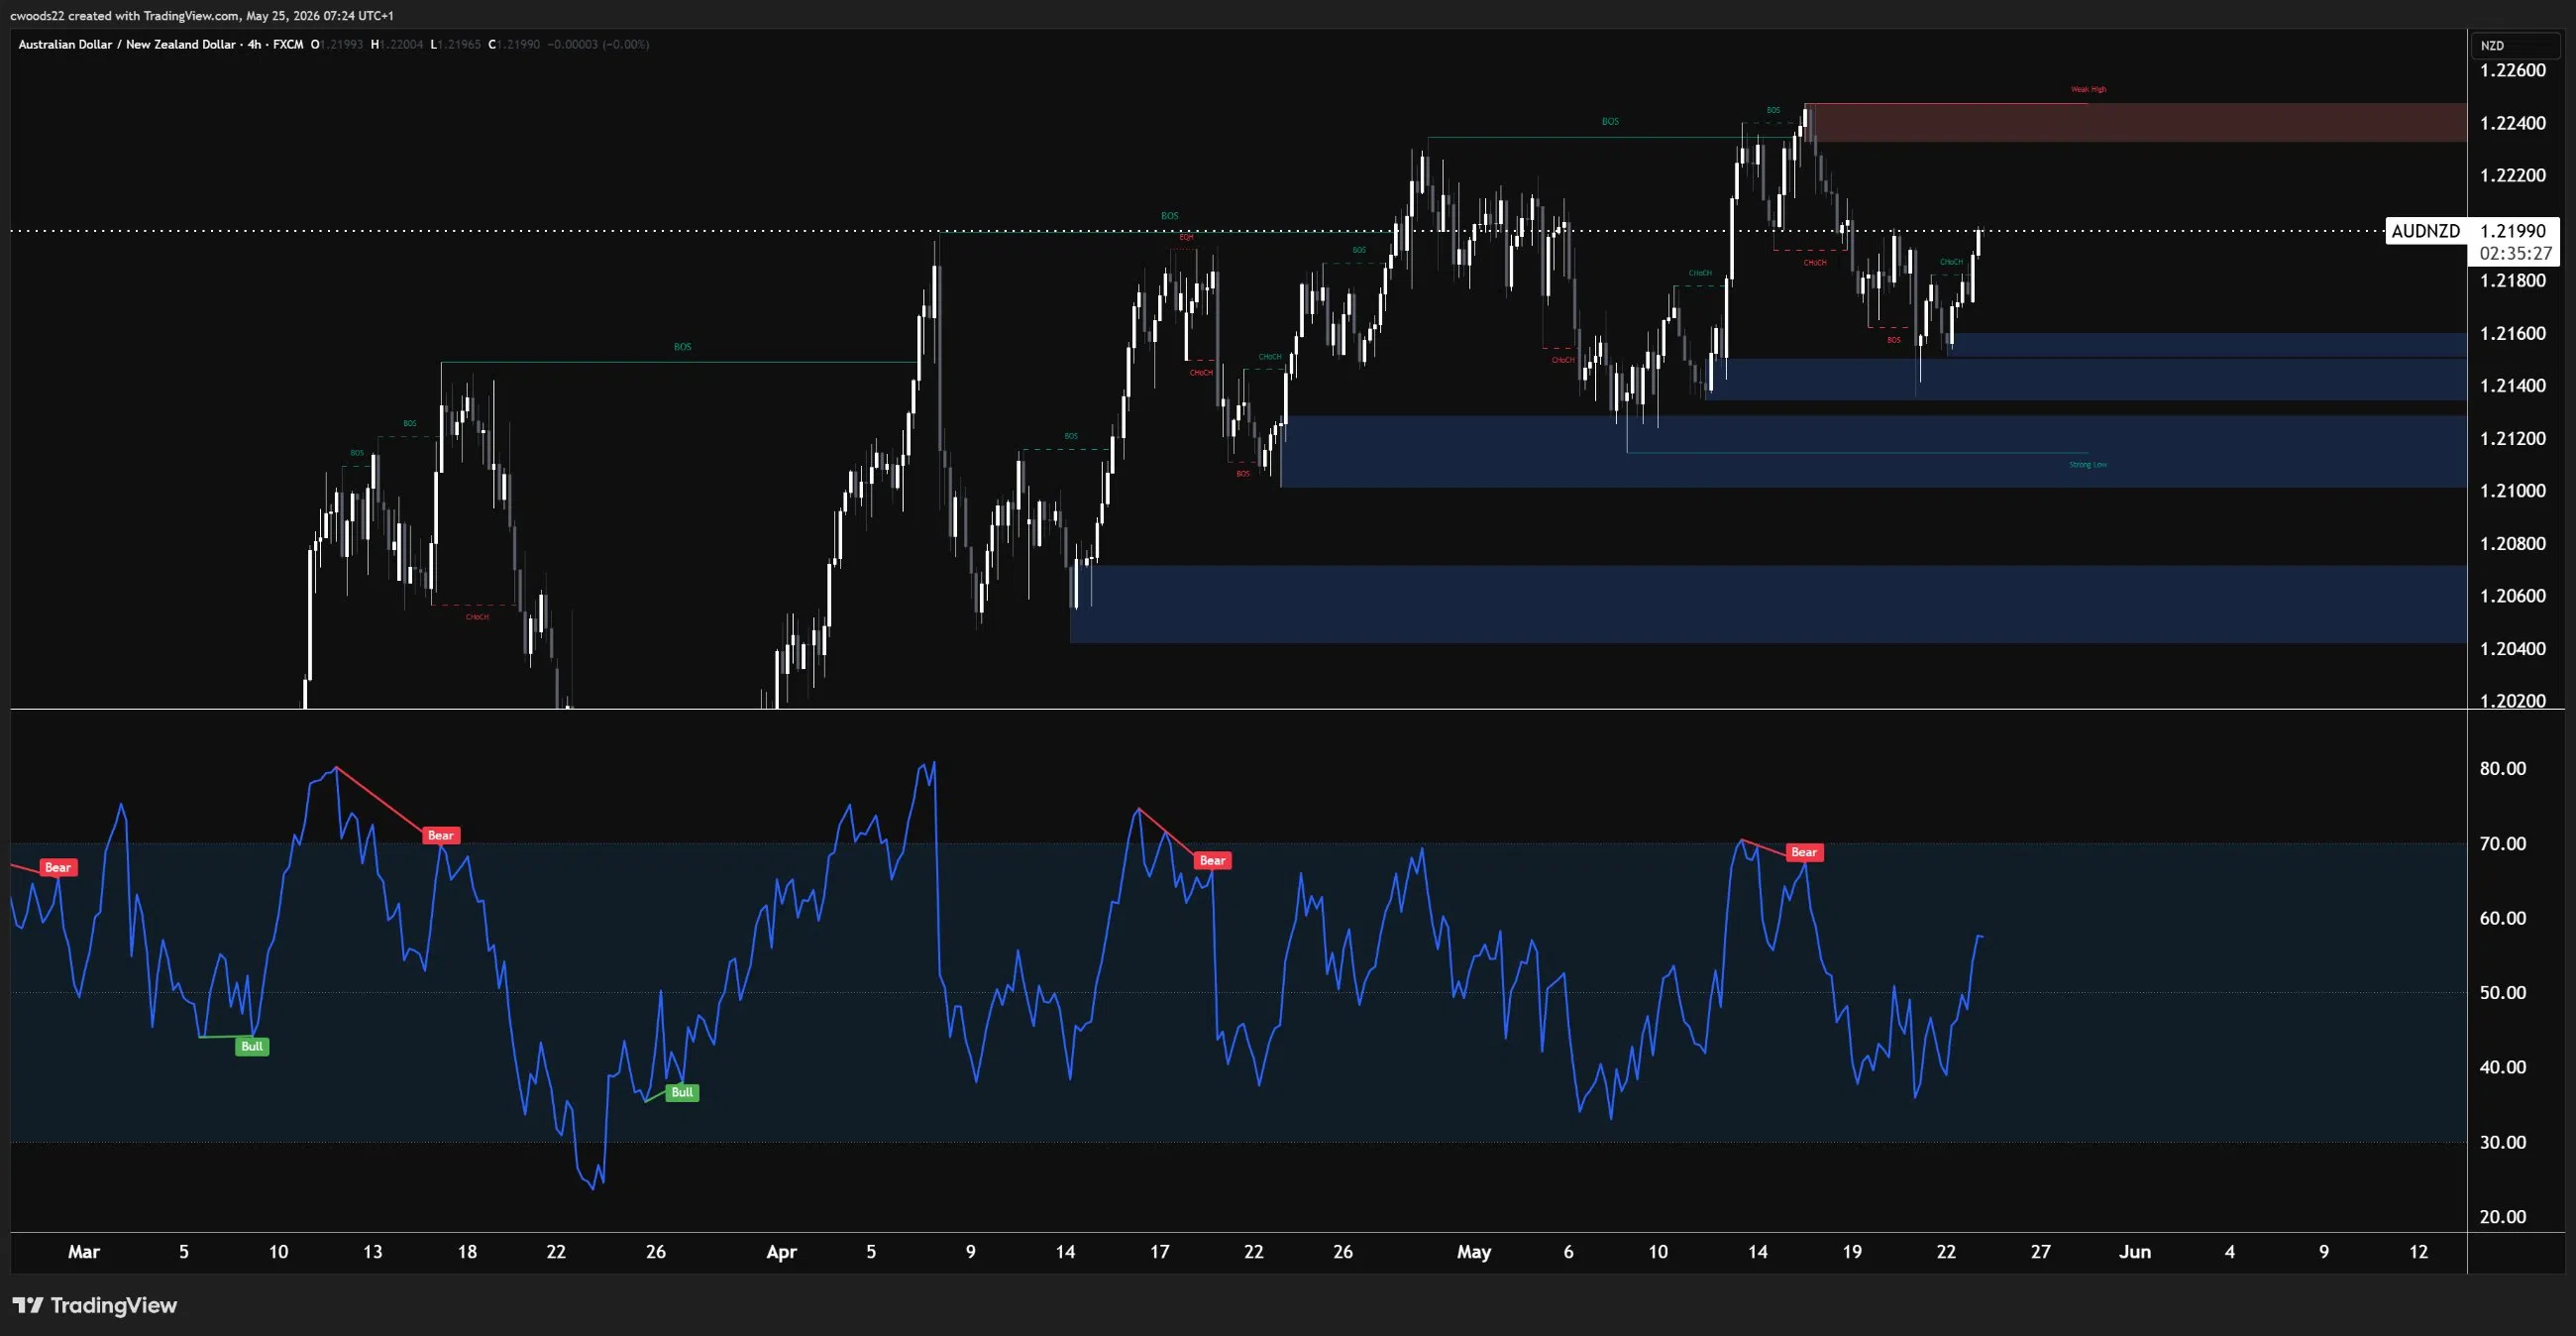
AUD/NZD at 1.2199 is one of the most interesting setups on the board this week because two central bank catalysts land within 30 minutes of each other on Wednesday morning. Australian CPI at 01:30 UTC followed by the RBNZ decision at 02:00 UTC. That is a one two punch that will determine whether this pair breaks out or reverses.
The H4 chart shows a bullish structure from the March lows near 1.2020. Price has carved out multiple Break of Structure (BOS) confirmations on the way up, establishing a series of higher highs and higher lows. The Strong Low at 1.2100 to 1.2150 has been clearly defined and has held on every pullback, while the Weak High near 1.2260 is where the current rally has stalled. There is a supply zone at 1.2230 to 1.2260 that has rejected price twice, and a deeper demand zone at 1.2020 to 1.2060 that represents the base of the entire move.
Here is the warning though. The RSI on the H4 is flashing a bearish divergence signal. Price has been making higher highs while RSI has been making lower highs, and the latest “Bear” crossover signal has appeared right at current levels. Bearish divergence does not guarantee a reversal, but it tells us the momentum behind the rally is fading.
The fundamental setup is what makes this trade so compelling. Australian CPI is forecast to cool slightly to 4.4% year on year from 4.6%, but the RBA’s trimmed mean measure (the one they actually target) was running at 3.3% and is expected to remain sticky. If trimmed mean CPI comes in above expectations, it reinforces the RBA’s hawkish stance. The RBA has already hiked three times in 2026, taking rates to 4.35%, and the market would start pricing a fourth.
On the other side, the RBNZ is expected to hold at 2.25%. New Zealand has been cutting rates since August 2025 and is 200 basis points below the RBA. But there is a 25% chance of a surprise hike priced in, and the RBNZ’s statement will be closely watched for any hawkish pivot given the oil driven inflation surge. If the RBNZ holds and sounds cautious while the AUD CPI comes in hot, the rate differential widens further in Australia’s favour and AUD/NZD pushes through the 1.2260 Weak High. If the reverse happens, a hot RBNZ surprise with a soft AUD CPI, the RSI divergence could trigger a pullback toward the 1.2100 to 1.2150 Strong Low.
What to Watch This Week
Monday is US Memorial Day, so US equity and bond markets are closed. Liquidity will be thinner than usual across forex and commodities. Use the quiet session to set alerts at the key levels discussed above rather than forcing trades in thin conditions.
Tuesday brings no major high impact releases, but keep an eye on the general risk tone as markets digest the holiday weekend and position ahead of Wednesday’s central bank events.
Wednesday is the day that matters most. Australian CPI lands at 01:30 UTC (headline forecast 4.4%, previous 4.6%, trimmed mean previous 3.3%) followed immediately by the RBNZ decision at 02:00 UTC (forecast hold at 2.25%) and the RBNZ press conference at 03:00 UTC. This 90 minute window will drive AUD/NZD and set the tone for the Antipodean currencies for the rest of the week.
Thursday is the US data dump: Q1 GDP second estimate at 12:30 UTC (forecast 2.0%, up from the preliminary 0.5%), Core PCE (the Fed’s preferred inflation gauge, previous 0.3% month on month), Durable Goods Orders (previous 0.8%), and Personal Income and Spending data. The GDP revision is the one to watch. If Q1 growth gets revised from 0.5% to 2.0%, it would be the largest upward GDP revision in years and would reinforce the narrative that the US economy is strong enough to absorb higher rates. The New Zealand government also releases its Budget 2026 on Thursday, which could add volatility to NZD pairs.
Friday closes with Eurozone CPI flash data at 12:00 UTC (forecast 2.8%, previous 2.9%) and Canada Q1 GDP (previous minus 0.6% annualised). The Eurozone number is important because the ECB is expected to cut rates in June, and a softer CPI reading would seal that decision. Canada’s GDP will test the loonie after last week’s oil and CAD correlation analysis in Coffee and Charts.