
Key Points
- GBP/USD rallied to 1.3500 on the initial optimism around Andy Burnham becoming Prime Minister, but reversed after his “fiscal flexibility” comments on day one spooked the gilt market and sent long-dated yields to their highest since May. The 15 minute chart shows a bear RSI divergence at the recent high and a supply zone between 1.3470 and 1.3500 that capped the recovery. The low near 1.3390 to 1.3400 is the first target if sterling continues to weaken, with UK CPI data tomorrow adding a catalyst that could amplify the move in either direction.
- Gold is recovering from the July 17 lows near $3,975 and has climbed to $4,072 on safe haven demand as the Iran conflict enters its ninth consecutive night of US strikes. The demand zone between 4,030 and 4,050 is where the bullish change of character was confirmed, and a pullback to that area would offer a higher probability entry. Two bear RSI divergences at the current level suggest a dip before the next push toward the high near 4,080 and the July 9 supply zone at 4,110 to 4,130.
- The NASDAQ 100 crashed from 29,700 to 28,400 last week as a global chip and AI valuation unwind hit sentiment, with the Nikkei falling 5.5% on Friday alone. A bull RSI divergence at the lows confirmed that the selling was exhausting, and the recovery to 28,946 has been supported by a series of bullish change of character and break of structure signals. Alphabet and Tesla both report Wednesday after the close, and the results will determine whether the index pushes through the high near 29,000 and targets the supply zones at 29,200 and 29,400.
Trade 1: GBP/USD Short from Supply
| Pair | Direction | Entry Zone | Target 1 | Target 2 | Invalidation |
| GBP/USD | Short | 1.3450 to 1.3480 | 1.3400 | 1.3380 | Above 1.3510 |
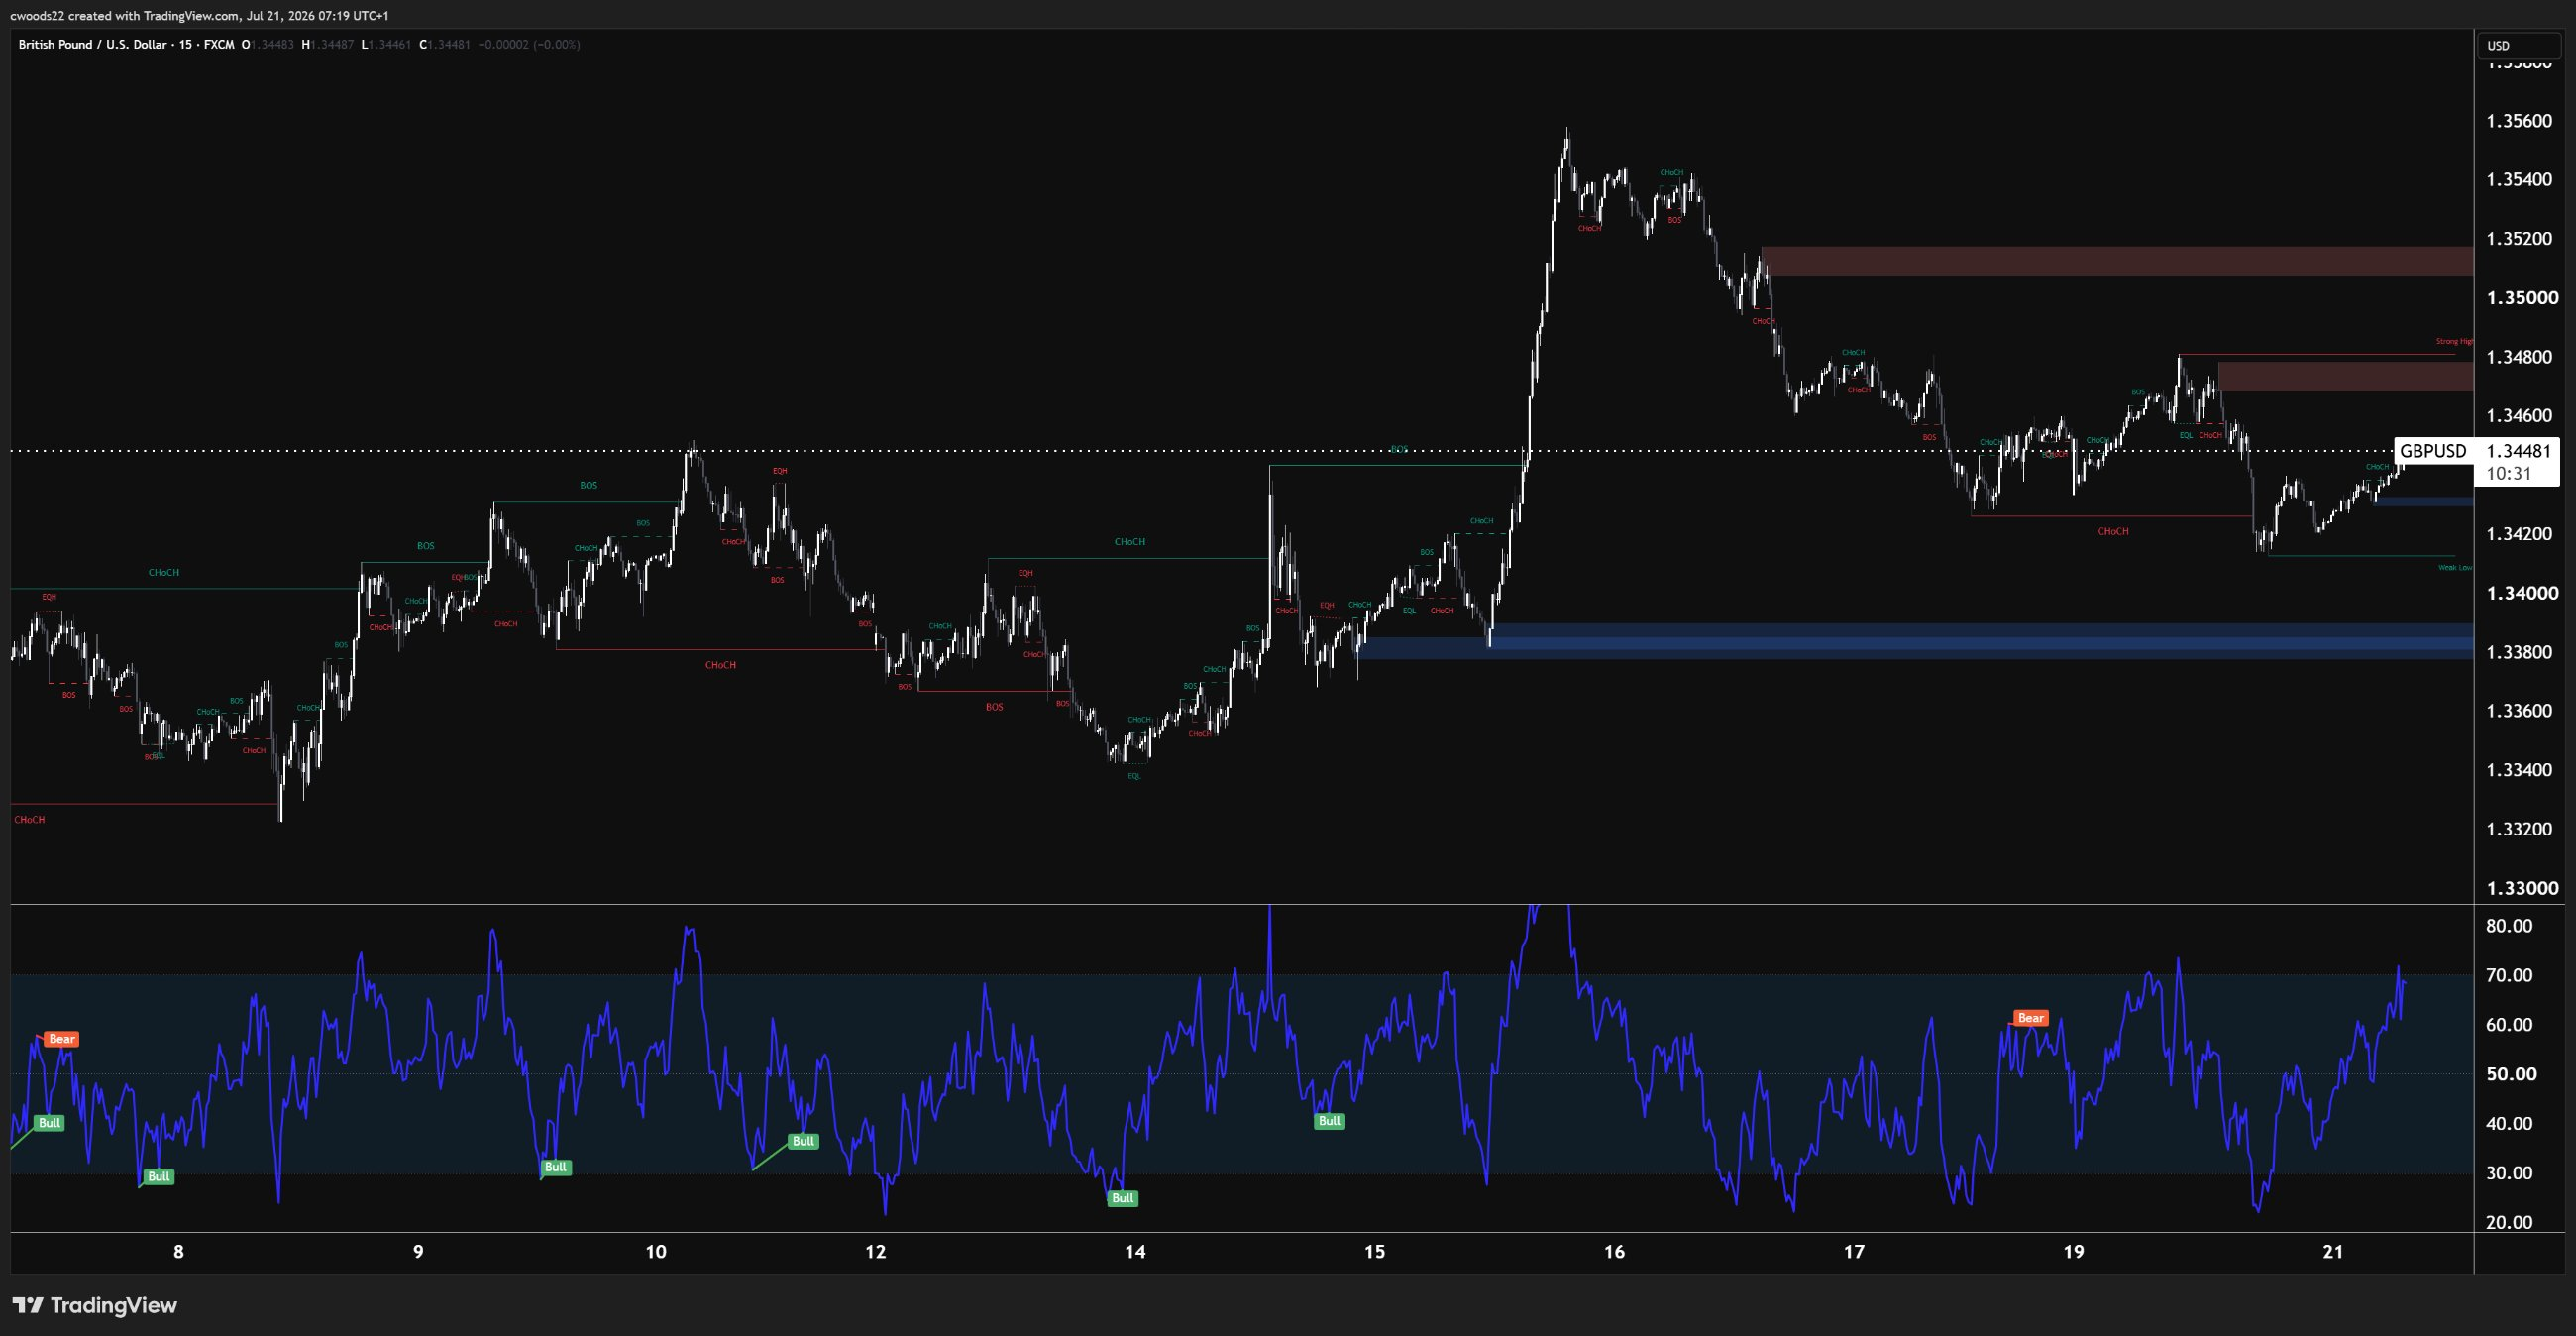
Chart: GBP/USD, 15min timeframe (TradingView, SMC)
Andy Burnham was confirmed as the UK’s new Prime Minister on July 19, succeeding Keir Starmer as the country’s seventh PM in ten years. Markets initially responded positively when reports emerged that Shabana Mahmood, seen as fiscally cautious, would be appointed Chancellor. GBP/USD climbed to its strongest level since January, briefly touching 1.3500. That optimism was short lived. On his first full day in office, Burnham told reporters he would seek “any flexibility” within the government’s borrowing and spending rules. Gilt markets reacted immediately, with long-dated yields surging to their highest since late May. The pound reversed and turned negative on the session.
The 15 minute chart captures the aftermath. Price rallied from the demand zone near 1.3380 to 1.3420 (the blue shaded area) up toward the supply zone between 1.3470 and 1.3500 (the red shaded area) on the PM transition news. The supply zone has held, and the bear RSI divergence at the recent high confirms that buying momentum faded as the fiscal concerns took hold.
The entry zone sits between 1.3450 and 1.3480, which is the current area and the lower edge of supply. Sellers are positioned here and the structure favours a move lower. The first target is 1.3400, where the low sits and where previous break of structure occurred. The extended target is 1.3380, the bottom of the demand zone. Invalidation is above 1.3510, where a clean break above supply would negate the bearish setup and suggest that sterling has absorbed the fiscal concerns.
Tomorrow’s UK CPI release is the wildcard. The consensus is 3.6% year on year (up from 2.8% in May), driven by the energy price cap increase. A hot print would normally be sterling positive (it reinforces Bank of England rate hike expectations ahead of the July 30 decision), but in the context of a new PM signalling fiscal looseness, higher inflation paired with higher spending is a stagflation concern. If CPI comes in above 3.6%, watch the gilt market’s reaction as closely as the pound’s.
Trade 2: Gold (XAUUSD) Long from Demand
| Pair | Direction | Entry Zone | Target 1 | Target 2 | Invalidation |
| XAUUSD | Long | 4,030 to 4,050 | 4,080 | 4,120 | Below 3,990 |
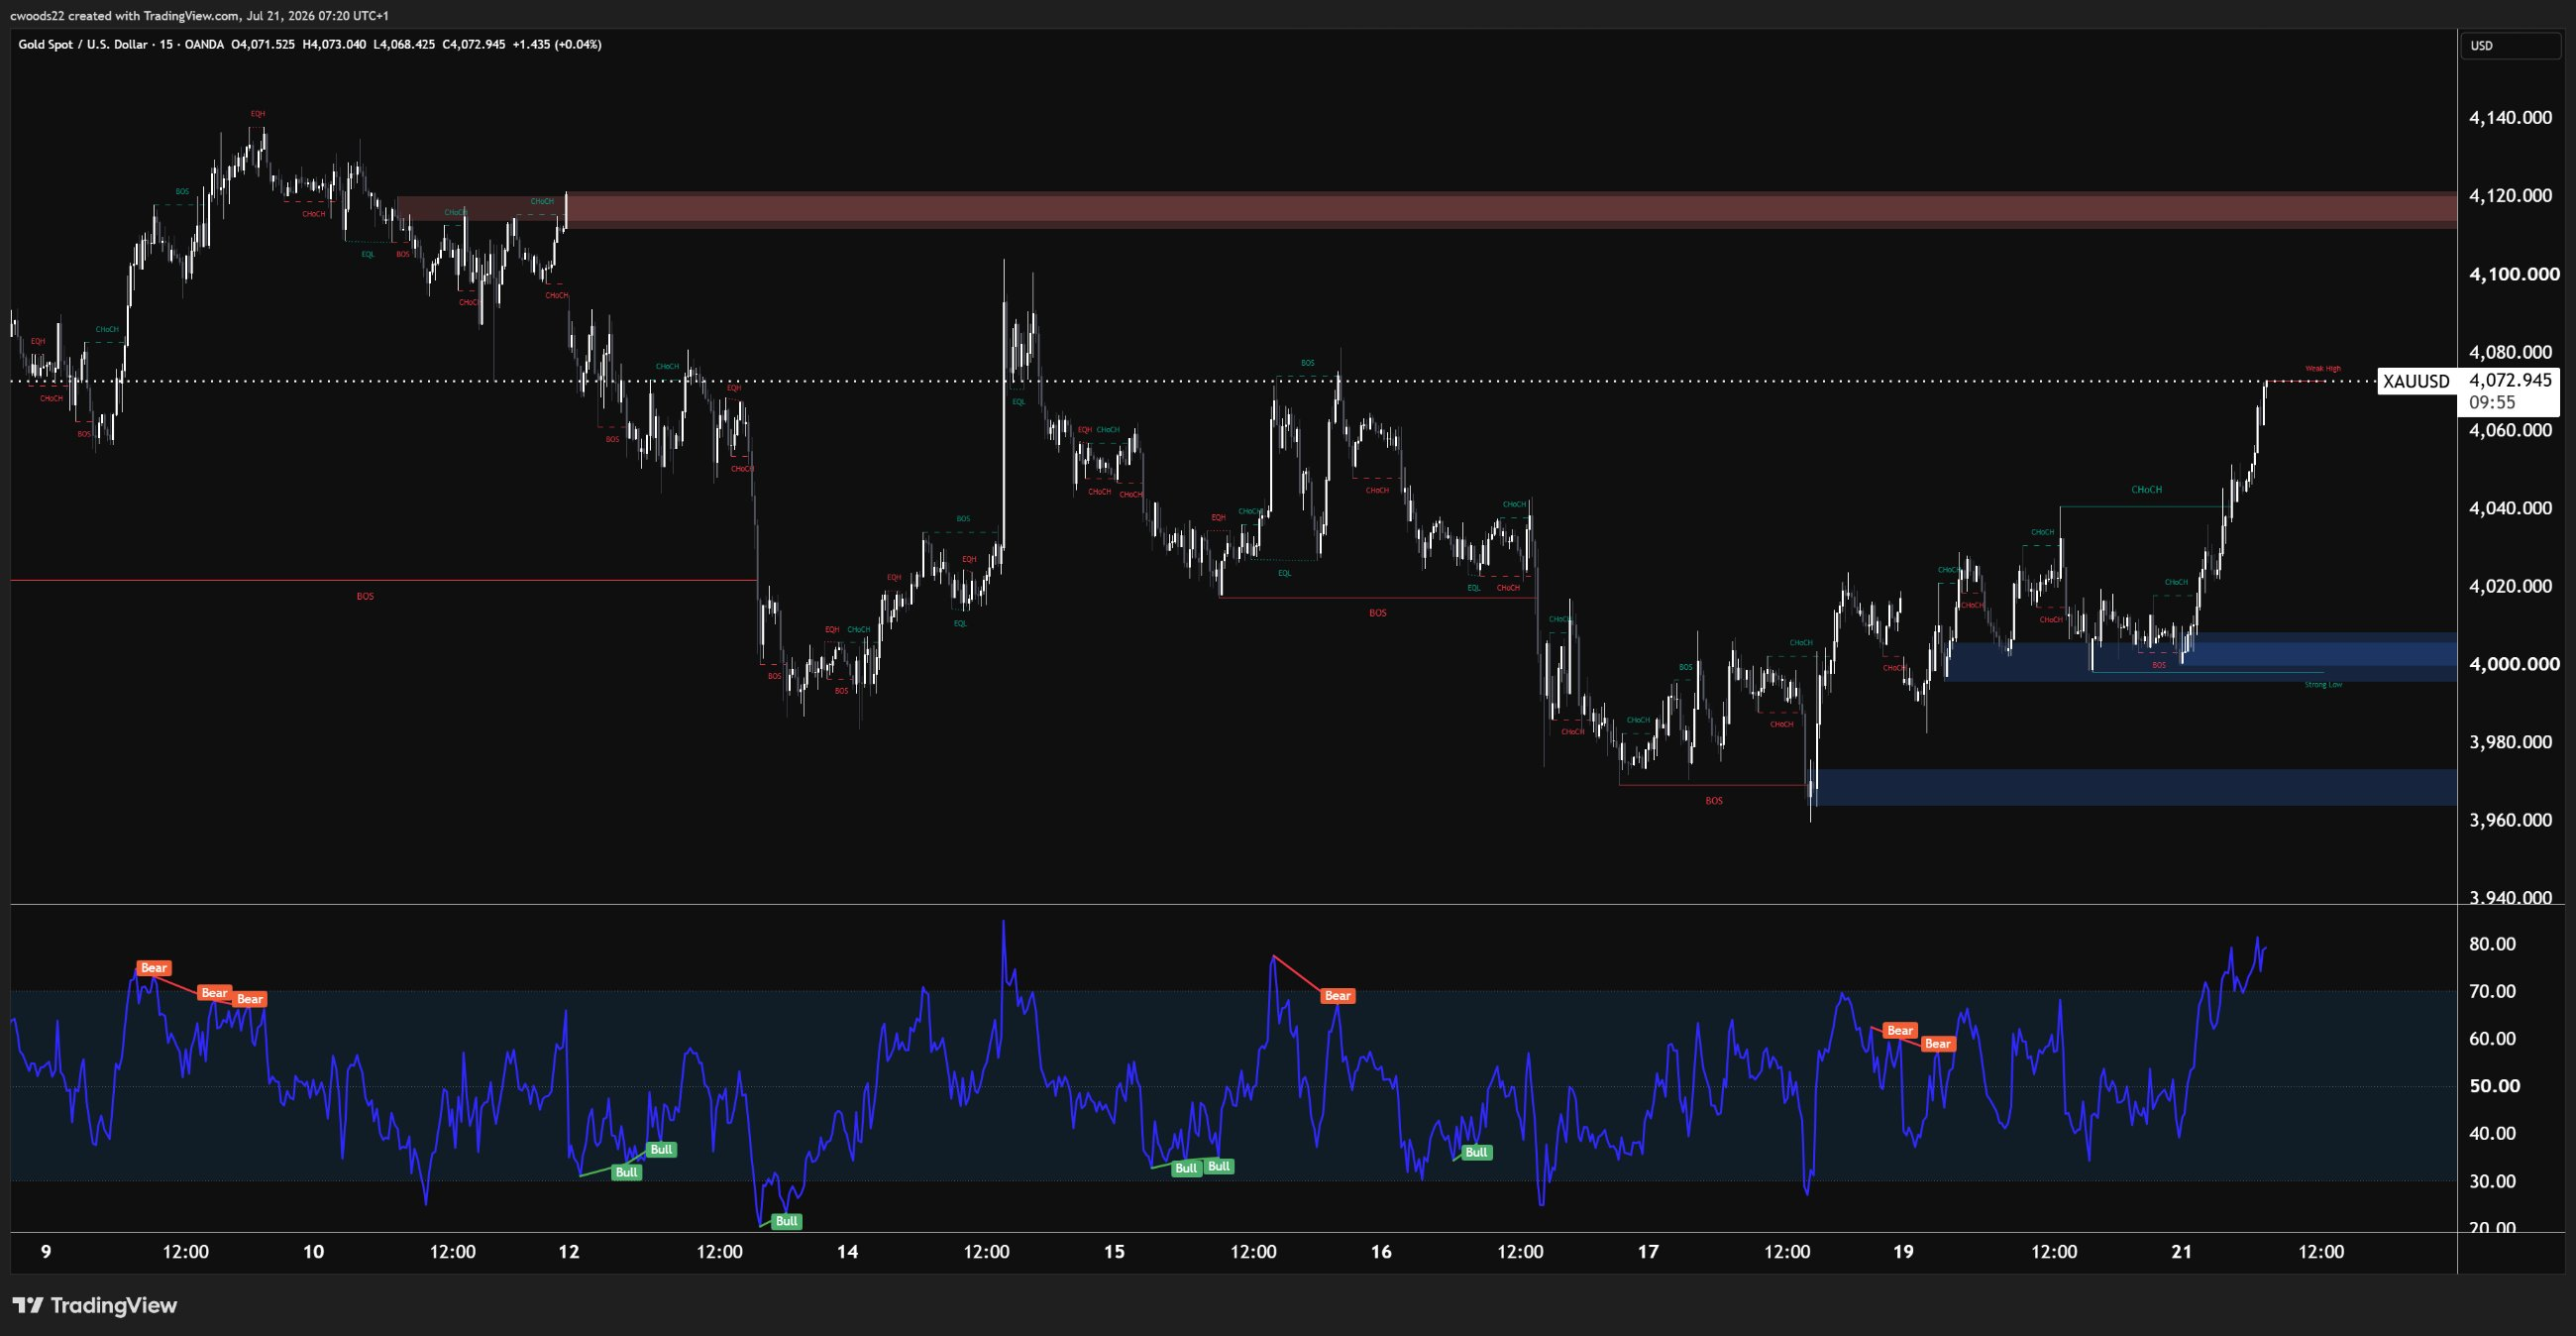
Chart: Gold (XAUUSD), 15min timeframe (TradingView, SMC)
Gold is trading at $4,072 and has been climbing from the July 17 lows near $3,975. The rally has been driven by safe haven demand as the Iran conflict continues to escalate: the US has conducted nine consecutive nights of strikes, Iran’s Revolutionary Guard has re-closed the Strait of Hormuz, and commercial shipping through the waterway has nearly stopped. In any normal environment, this backdrop would send gold substantially higher. The complication is that the same conflict is driving oil prices to $84 a barrel, which is stoking inflation expectations and keeping the Fed pinned at 3.50% to 3.75%. This creates what analysts have called the “safe haven paradox”: the event that should be most bullish for gold is simultaneously strengthening the headwinds against it.
The 15 minute chart shows the recovery from the lows clearly. The demand zone between 4,030 and 4,050 (the blue shaded area on the right) is where the bullish change of character was confirmed, marking the structural shift from sellers to buyers. Price has since climbed through a series of change of character and break of structure moves to the current level at 4,072, just below the high near 4,080.
Two bear RSI divergences have appeared at the current level, signalling that the momentum behind the rally is fading in the short term. This does not negate the bullish structure, but it suggests that a pullback to demand before the next leg higher is the higher probability path. The entry zone is 4,030 to 4,050, where the confirmed change of character sits and where buyers should step in if the bullish thesis remains intact. The first target is 4,080, the high that price is currently testing. The extended target is 4,120, the supply zone from July 9 where the initial sell off from 4,150 began. Invalidation sits below 3,990, where a break beneath the low would suggest the safe haven bid has evaporated and gold is repricing for higher rates rather than geopolitical risk.
Trade 3: NASDAQ 100 (US100) Long ahead of Earnings
| Pair | Direction | Entry Zone | Target 1 | Target 2 | Invalidation |
| US100 | Long | 28,700 to 28,950 | 29,200 | 29,400 | Below 28,400 |
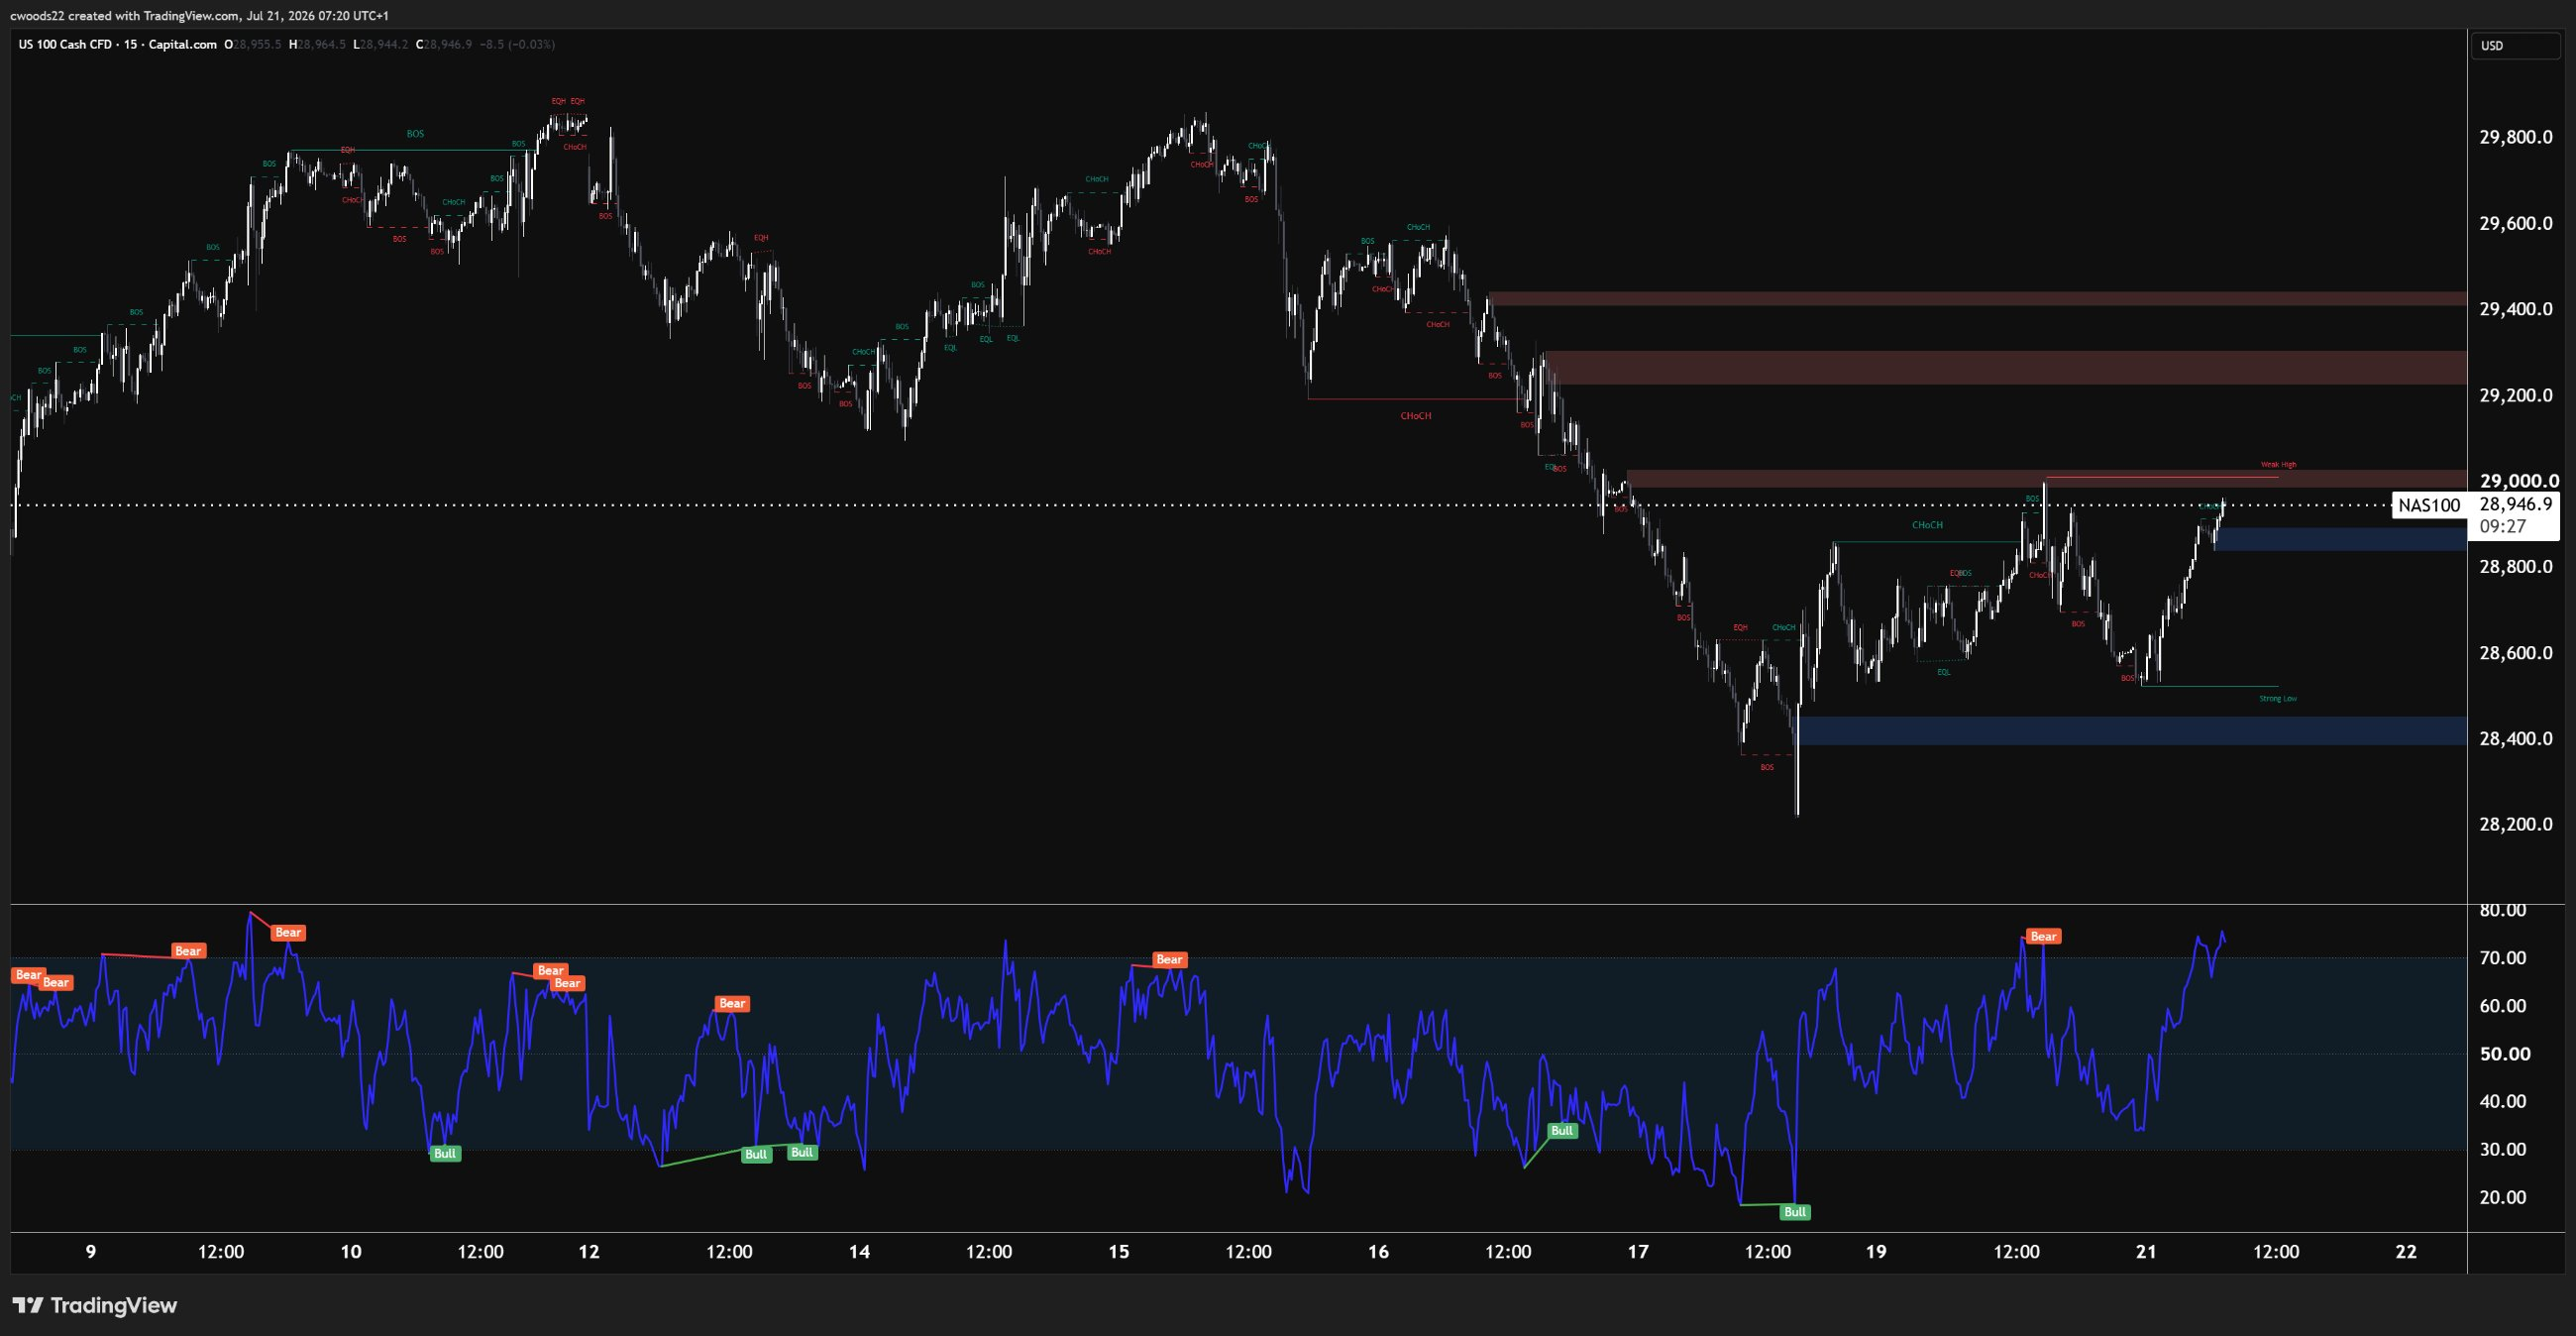
Chart: NASDAQ 100 (US100), 15min timeframe (TradingView, SMC)
The NASDAQ 100 has had a brutal ten days. From the July 10 highs near 29,800, the index sold off to 28,400 on July 17, a decline of nearly 5%. The catalyst was not earnings or economic data. It was a global AI and semiconductor valuation unwind, led by Japan’s Nikkei 225 which crashed 5.5% on Friday alone. Memory chip names like Kioxia and Sumco fell 15% to 16% in a single session as investors questioned whether the AI capital expenditure cycle is producing real returns fast enough to justify the valuations attached to it.
The 15 minute chart shows the damage on the left and the recovery on the right. The sell off from 29,800 was impulsive, with multiple bear RSI divergences at the highs confirming the distribution and a series of break of structure moves through 29,500, 29,200, 28,800, and 28,600 establishing the bearish structure. The demand zone near 28,350 to 28,450 (the blue shaded area at the bottom) is where the decline stopped.
The bull RSI divergence at the 28,400 low is the key signal. Price made its lowest low while the RSI printed a higher low, confirming that the selling pressure had exhausted. The recovery since has been constructive: a bullish change of character at 28,600 was followed by break of structure moves through 28,700, 28,800, and 28,900. The high near 29,000 to 29,050 is the first structural hurdle, and the fact that it represents a level where previous structure shifted suggests it is likely to be taken rather than defended.
The entry zone is 28,700 to 28,950, the current area and any pullback toward the confirmed break of structure level. A bear RSI divergence at the current level suggests a brief dip may come first, which would offer a better risk to reward entry. The first target is 29,200, the lower edge of the first supply zone. The extended target is 29,400, the second supply zone where heavier selling is likely to emerge. Invalidation sits below 28,400, where a break beneath the low and the demand zone would suggest the AI unwind is accelerating rather than stabilising.
The catalyst is clear: Alphabet and Tesla both report after the close on Wednesday. Google Cloud grew 63% year on year to $20 billion in Q1, with its order backlog nearly doubling to $462 billion. Tesla projected 450,000+ production and 480,000+ deliveries for Q2. If both companies beat expectations and guide positively on AI spending, the NASDAQ 100 has room for a sharp relief rally toward the supply zones. If either disappoints, particularly Alphabet on cloud growth, the rotation out of tech that started last week accelerates and the low at 28,400 comes back into play.
Risk Warning: Trading financial instruments, particularly those involving leverage, involves a substantial degree of risk and is not appropriate for all investors. The value of your investments can rise or fall sharply, and it is possible to lose the entirety of your invested capital. Do not trade with funds you cannot afford to lose. Nothing in this site should be read or construed as constituting advice on the part of Taurex or any of its affiliates, directors, officers or employees.