
Key Points
- Wednesday’s US September CPI is the week’s main event, with a Reuters poll expecting 3.6 percent headline and 2.5 percent core year on year, alongside the start of bank earnings on Tuesday and TSMC’s full third quarter report on Thursday.
- Gold is trading at 4,192.82, rebounding from a low near 4,065 into the supply zone between 4,160 and 4,225, with the broader trend still lower from a high near 4,510 in early September.
- The S&P 500 sits at 7,838.1, just below its record high near 7,845, after rebounding from a pullback into the 7,700 to 7,755 demand zone.
Last Week in Review
The Federal Reserve’s September minutes, released Wednesday, confirmed that all 19 officials backed the 25 basis point hike to 3.75 to 4.00 percent, with most still expecting another increase by year end. The near-term message was more patient: Governor Waller said further hikes need not come at consecutive meetings, St. Louis Fed President Musalem said more firming is needed but did not back a move this month, and implied odds of an October hike have fallen to roughly 20 percent, while money markets still priced around an 81 percent chance of a December move on Thursday.
Friday brought two soft readings. Canada’s September jobs report showed 68,000 jobs lost against a forecast gain of 9,200, lifting the unemployment rate to 6.5 percent and cutting the odds of a Bank of Canada hike on 28 October to about 25 percent. The University of Michigan’s preliminary October sentiment index fell to 46.3 against a forecast of 47.6, with one-year inflation expectations edging up to 4.7 percent.
Equities finished the week higher despite a Thursday tech sell-off triggered by a report that OpenAI’s annualised revenue was about 20 billion dollars below projections. The S&P 500 gained 1.2 percent on the week to close at 7,811.54 on Friday, within reach of the record close set on Tuesday, while gold rose about 1.3 percent after touching a two-month low midweek.
Gold: Rebound Meets Supply Below 4,225
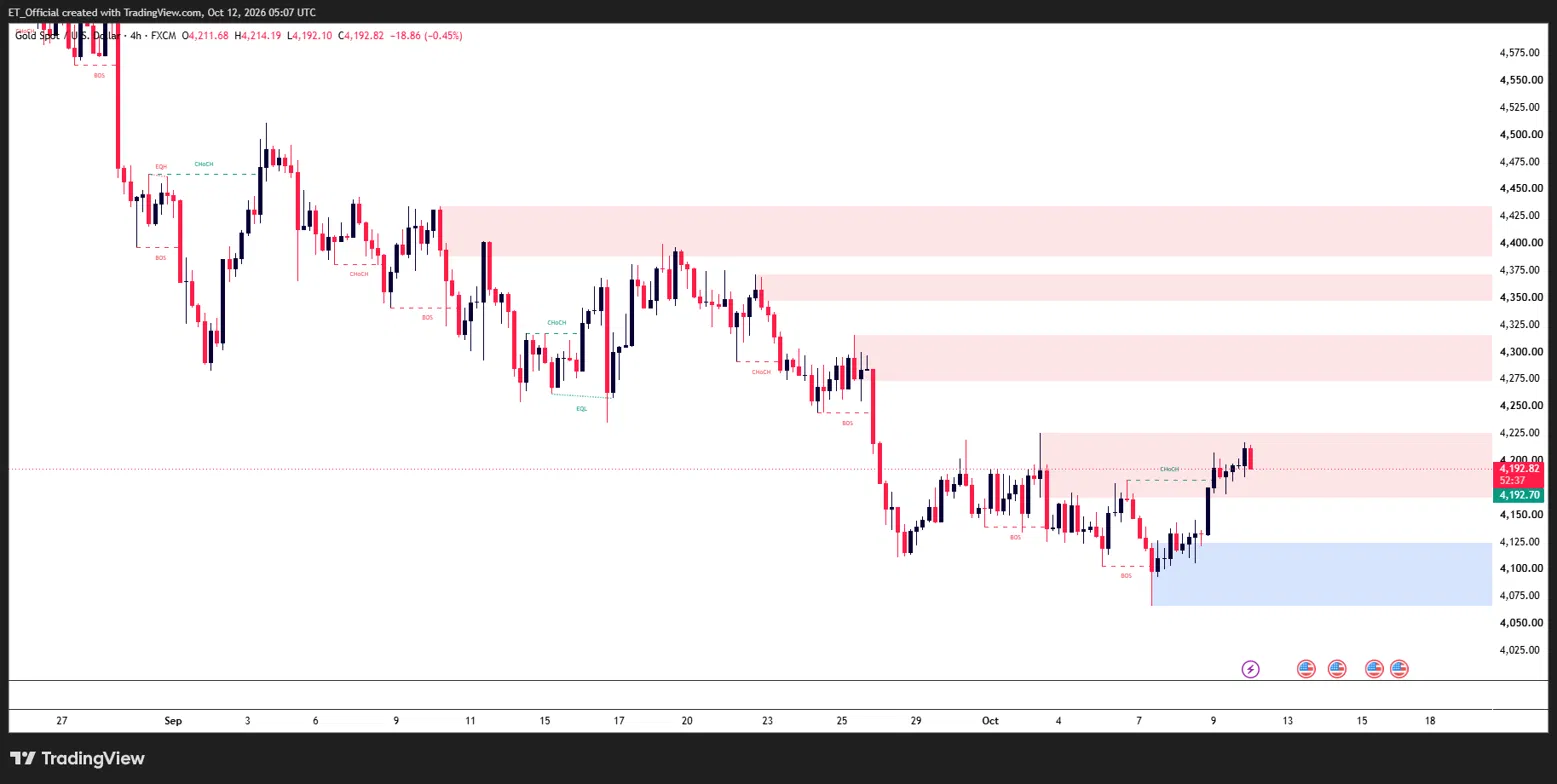
Chart: Gold (XAU/USD), 4H timeframe (TradingView, SMC)
Gold (XAU/USD) 4H chart, 27 August to 12 October 2026: price fell from a high near 4,510 in early September to a low near 4,065 on 7 October, and has rebounded to 4,192.82, testing the 4,160 to 4,225 supply zone.
The 4H chart shows gold in a persistent downtrend since early September, falling from a high near 4,510 through a series of lower highs and breaks of structure to a low near 4,110 in late September. Price then ranged between 4,110 and 4,225 before sweeping lower to a fresh low near 4,065 midweek, where the demand zone between 4,065 and 4,125 triggered a sharp rebound.
That rebound has carried price back to 4,192.82, just inside the supply zone between 4,160 and 4,225, with a change of character marked on the way up. The bounce is a counter-trend move within a still-bearish structure, and each earlier rally into supply this month has been rejected, so this zone is the first real test of whether buyers can flip the trend.
A rejection from here would put the 4,065 to 4,125 demand zone back in play, with Wednesday’s CPI the most likely catalyst. Above the supply zone, the 4,275 to 4,315 region is the next resistance, with the 4,350 to 4,430 area and the high near 4,510 further out. A hotter inflation print that revives rate hike bets would likely weigh on gold, while a softer one could give buyers room to push through.
S&P 500: Pressing Against the Record High Ahead of CPI
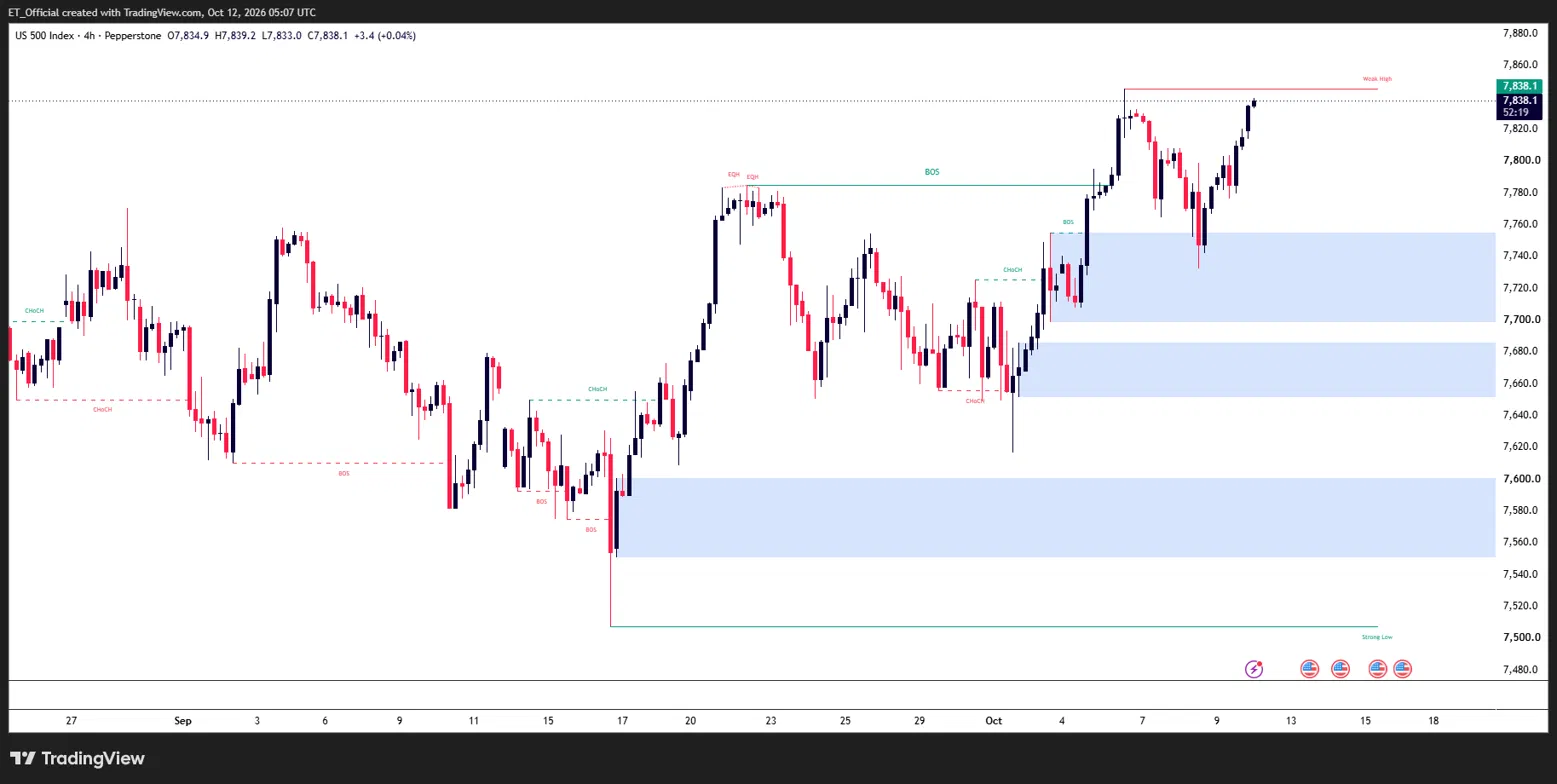
Chart: S&P 500 (US500), 4H timeframe (TradingView, SMC)
S&P 500 (US500) 4H chart, 27 August to 12 October 2026: price rallied from a low near 7,510 on 17 September to a high near 7,845 on 6 October, pulled back to 7,731, and is now trading at 7,838.1 just below that high.
The 4H chart shows the index rebuilding from a low near 7,510 on 17 September, rallying to a high near 7,785 before pulling back, then breaking structure higher through that level in early October. That push carried price to a record high near 7,845 on Tuesday, followed by a pullback to 7,731 on Thursday into the demand zone between 7,700 and 7,755, which held.
Price has since recovered to 7,838.1, back within a few points of the record high. Bank earnings are the first test of that strength, with JPMorgan, Goldman Sachs, Citigroup and Wells Fargo reporting Tuesday and Morgan Stanley and Bank of America following Wednesday. Bank stocks have lagged, with the S&P 500 banks index down 9 percent over the past month, while analysts expect S&P 500 earnings to grow more than 30 percent in the third quarter. TSMC’s full report on Thursday adds a read on AI chip demand after last week’s semiconductor sell-off.
Overhead, a clean break above the 7,845 high would put the index in price discovery, with no resistance marked above it. Below current price, the 7,700 to 7,755 demand zone is the first support to hold, with the 7,650 to 7,685 zone and the 7,550 to 7,600 zone further out if a hot CPI print triggers a deeper pullback.
Key Events This Week
Monday 12 October Holiday-Thinned Trading
Columbus Day is a US federal holiday with the bond market partly affected, and Canada is closed for Thanksgiving, so liquidity is likely to be thin with little scheduled data.
Tuesday 13 October Bank Earnings and RBA Minutes
JPMorgan, Goldman Sachs, Citigroup and Wells Fargo open the bank earnings season, with Johnson & Johnson and UnitedHealth also reporting. The RBA releases minutes from its late-September meeting, where it raised the cash rate to 4.60 percent, and OPEC publishes its monthly oil market report.
Wednesday 14 October US September CPI
Consumer prices are due at 8:30am ET, with a Reuters poll expecting 3.6 percent headline and 2.5 percent core year on year, up from 3.4 percent and 2.4 percent in August. It is the first major inflation print since the Fed’s September hike, and October and December rate pricing is sensitive to the result. Morgan Stanley, Bank of America and BlackRock report, and the Fed’s Beige Book follows at 2pm ET.
Thursday 15 October PPI, Retail Sales and TSMC
US producer prices and September retail sales are due, along with weekly jobless claims and the Philadelphia Fed and Empire State manufacturing surveys. TSMC reports its full third quarter results and holds its earnings call, after already reporting revenue up roughly 50 percent year on year. Australia’s September jobs report and UK GDP are also due.
Friday 16 October Fed Chair Warsh Speaks
Fed Chair Kevin Warsh joins a moderated conversation at the IMF Annual Meetings in Bangkok at 04:30 GMT, a chance for fresh commentary on inflation and policy ahead of the Fed’s 27 to 28 October meeting. US industrial production and import and export prices are also due.
Risk Warning: Trading financial instruments, particularly those involving leverage, involves a substantial degree of risk and is not appropriate for all investors. The value of your investments can rise or fall sharply, and it is possible to lose the entirety of your invested capital. Do not trade with funds you cannot afford to lose. Nothing in this site should be read or construed as constituting advice on the part of Taurex or any of its affiliates, directors, officers or employees.