
The United States saw mixed economic data, with the Headline Consumer Price Index (CPI) and core CPI falling less than expected, while the Job Openings Index exceeded forecasts. The Producer Price Index (PPI) declined, and unemployment claims dropped, reflecting a slight improvement in the labor market. In contrast, U.S. oil inventories decreased below expectations, while the University of Michigan Consumer Confidence Index fell short of estimates, indicating weak consumer sentiment. Globally, the UK experienced a contraction in GDP and industrial production, while the Bank of Canada cut interest rates. In Japan, GDP growth was lower than expected, with household spending declining. In China, new loans dropped sharply, signaling a slowdown in credit activity.
Market Analysis
US Dollar vs Swedish Krona
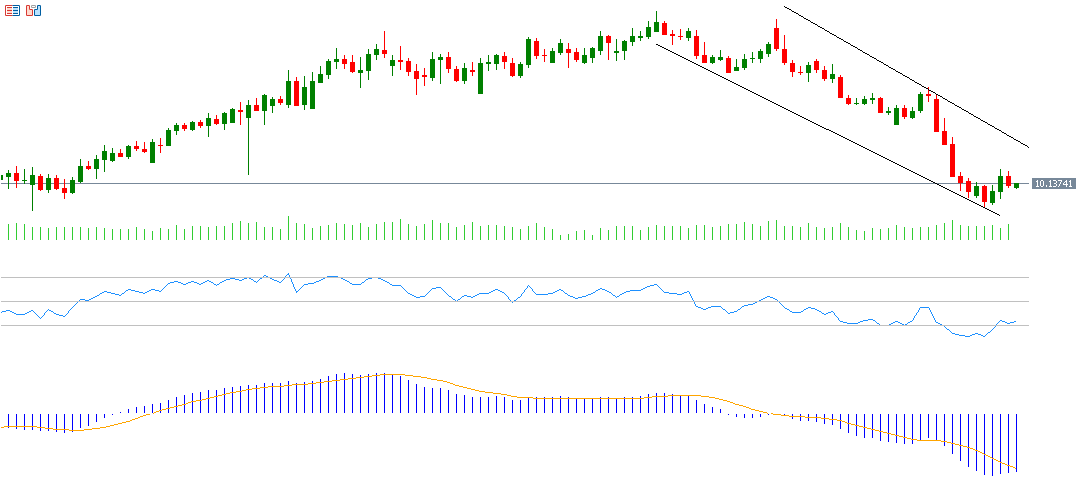
The US dollar against the Swedish krona stood at 9.9630 on March 11, 2025, the lowest level since December 29, 2023. The pair has dropped around 12% from its peak of 11.3101 on January 13, 2025, to its lowest point on March 11, 2025. The Relative Strength Index (RSI) currently stands at 32, indicating bearish momentum for the USD/SEK pair. The MACD indicator shows a bearish crossover between the blue MACD line and the orange SIGNAL LINE, suggesting negative momentum for the pair.
Nike
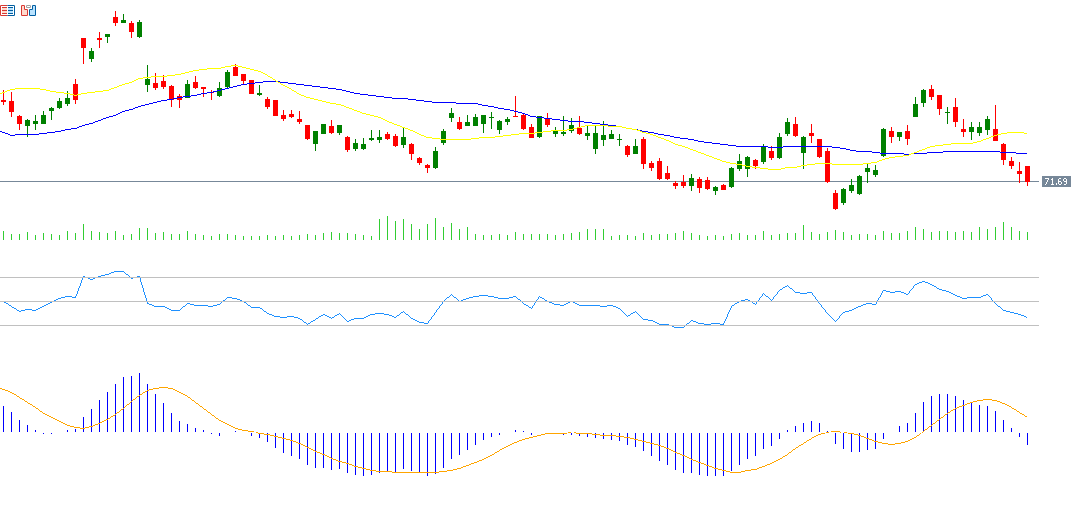
Nike’s stock has fallen by about 5% since the beginning of the year. The market is awaiting the company’s report, with expectations for earnings of $0.30 per share, down from $0.98 per share in the previous reading. Revenue is expected to reach $11.03 billion, down from $12.43 billion previously. The RSI is currently at 36, indicating bearish momentum for Nike’s stock. The MACD shows a bearish crossover, indicating negative momentum for the stock.
Gold
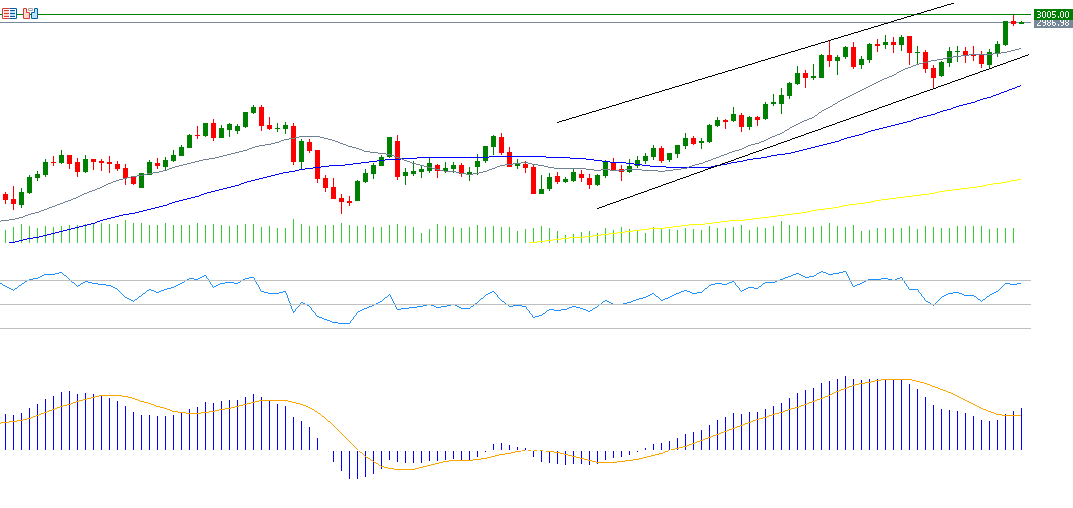
Gold reached a record high of $3,005 on Friday, March 14, 2025, driven by the trade war between the Trump administration and countries such as Canada, Mexico, China, and the EU, along with expectations for further US interest rate cuts (three expected this year), ongoing geopolitical tensions in the Middle East, and central banks’ gold purchases. The RSI currently stands at 67, indicating bullish momentum for gold. The MACD shows a bullish crossover between the blue MACD line and the orange SIGNAL LINE, suggesting upward momentum for gold.
Nasdaq 100
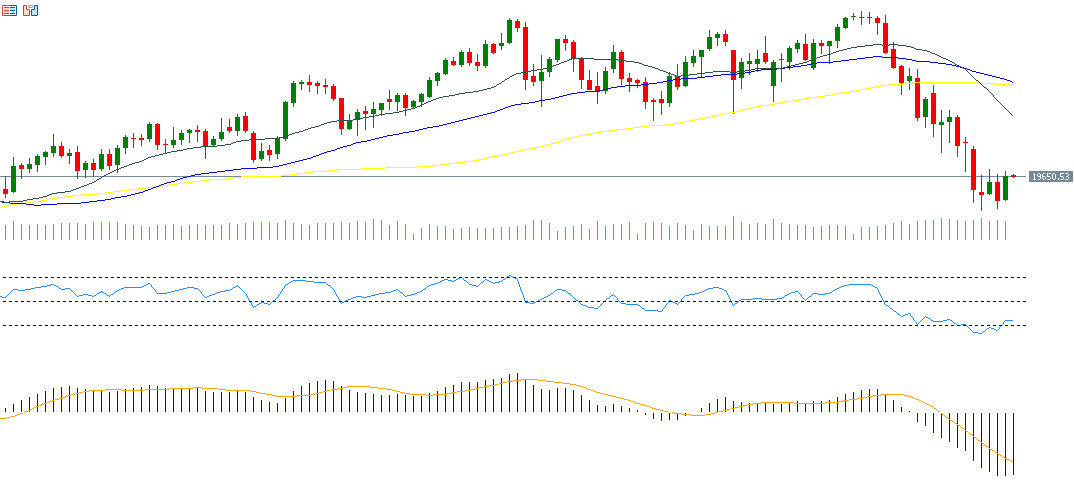
The Nasdaq 100 index hit 19,153 points on Thursday, March 13, 2025, its lowest level since September 12, 2024, and closed at 19,705 points on Friday, March 14, 2025. The index has fallen by 14% from its peak of 22,223 points on February 19, 2025, to the low observed on March 13. It has also dropped by around 6% since the start of the year through Friday’s close. Key factors weighing on U.S. stocks include fears of a U.S. economic slowdown, the trade war between the Trump administration and other nations, weak U.S. economic indicators, and a shift of funds from U.S. stocks to Chinese stocks, particularly in the tech sector. The RSI is currently at 38, indicating bearish momentum for the Nasdaq 100. The MACD shows a bearish crossover, signaling negative momentum for the index.
Key Events This Week
Markets are anticipating several important economic indicators and data releases this week:
- Today: The release of Fixed Asset Investment, Retail Sales, Industrial Production, and Unemployment Rate data for China, along with Retail Sales data for the U.S.
- Tuesday: Market participants are looking forward to the release of Building Permits and Industrial Production data for the U.S., as well as the Consumer Price Index (CPI) for Canada.
- Wednesday: Investors will be focused on the Federal Reserve’s interest rate decision, with expectations for rates to be kept at 4.25%-4.50%. Attention will also be on Federal Reserve Chairman Jerome Powell’s speech, which could provide guidance on future rate hikes, along with the dot plot. Additionally, Japan’s interest rate decision is expected to remain at 0.50%, alongside Export and Import data, the Eurozone’s CPI, and U.S. crude oil inventories.
- Thursday: The Bank of England’s interest rate decision is expected to remain at 4.50%, while the Swiss National Bank may reduce rates by 25 basis points to 0.25%. Other key releases include the People’s Bank of China’s lending rate, New Zealand’s GDP data, Australia’s employment and unemployment data, the Philadelphia Fed Manufacturing Index, U.S. existing home sales, and U.S. weekly jobless claims.
- Friday: Data on Japan’s CPI and UK Retail Sales will be released.
Please note that this analysis is provided for informational purposes only and should not be considered as investment advice. All trading involves risk.