
Gold prices fell yesterday, reaching $3,296 — their lowest level since June 9, 2025 — before closing at $3,324. Since reaching an all-time high of $3,500 on April 22, 2025, gold has been trading sideways in a horizontal range between strong support at $3,200 and firm resistance at $3,400, in search of a clear directional breakout, either upward or downward.
Despite this consolidation, gold remains up approximately 27% year-to-date, outperforming riskier assets like stocks and Bitcoin.
Currently, several factors are exerting downward pressure on gold prices, including:
- Easing geopolitical tensions between the United States and Iran, as well as between Israel and Iran, although markets remain cautious about the potential for renewed escalation.
- Remarks from Federal Reserve Chair Jerome Powell yesterday, where he urged patience regarding interest rate cuts, emphasizing the need to maintain current levels to assess the impact of tariffs on the economy, especially inflation and the labor market.
On the other hand, several factors continue to support gold prices:
- Ongoing central bank purchases, led by the People’s Bank of China, which continues to boost its gold reserves, supporting demand and price stability.
- A weaker U.S. dollar index, which dropped to 97.70 today — its lowest level since March 3, 2022 — further enhancing gold’s appeal as an alternative asset.
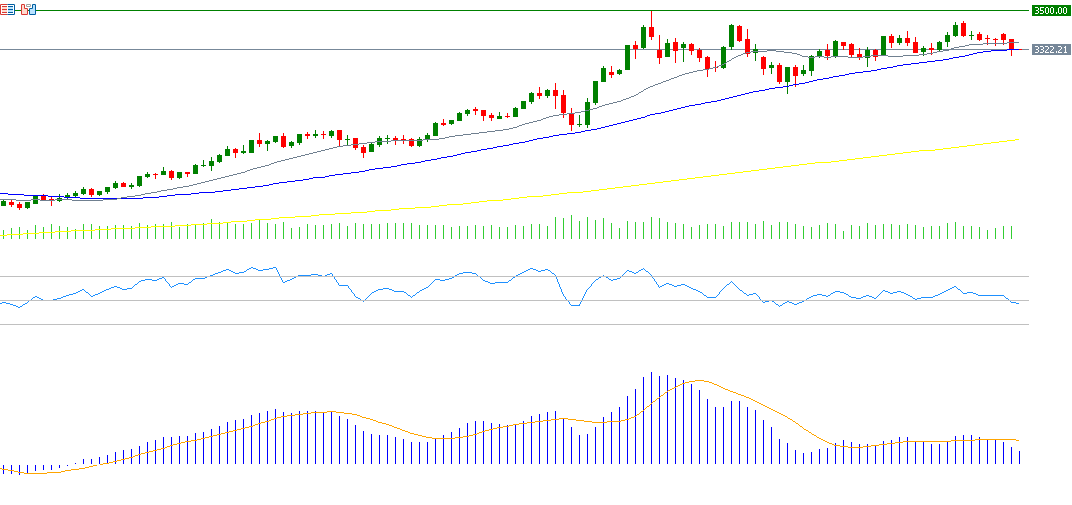
Technical Analysis:
Technical indicators currently suggest continued downside momentum for gold, due to the following reasons:
- The Relative Strength Index (RSI) is at 48, reflecting persistent bearish momentum.
- A bearish crossover in the MACD indicator, where the blue MACD line has crossed below the orange Signal Line, reinforces negative sentiment.
- Although the 20-, 50-, and 200-day moving averages are aligned in a constructive trend, gold closed below both the 20-day ($3,355) and the 50-day ($3,325) moving averages, adding to the short-term bearish outlook.
Please note that this analysis is provided for informational purposes only and should not be considered as investment advice. All trading involves risk.

