
Gold prices continue to reach new record highs, climbing to $3,500 yesterday. The yellow metal has surged approximately 18% from its low of $2,957 on April 7 to its recent peak. Since the beginning of the year, gold has risen by nearly 28%, outperforming high-risk assets such as Bitcoin, global equities, U.S. Treasury bonds, and most other commodities. This strong performance reflects growing investor concerns, prompting a shift towards the traditional safe-haven asset—gold. The yellow metal declined to trade currently near the $3,350 level, especially after U.S. President Donald Trump stated yesterday that he has no intention of dismissing Jerome Powell from his position as Chairman of the Federal Reserve. This was coupled with a calming of tensions with China, following Trump’s remarks that tariffs with China will not be set at 145%, but they also won’t be reduced to zero.
Key Fundamental Drivers Behind Gold’s Rally
Several fundamental factors support the continued rise in gold prices, including:
- The ongoing trade war between the Trump administration and several countries, particularly China.
- A weakening U.S. dollar.
- Concerns over potential stagflation in the U.S. economy.
- Central bank gold purchases, led by the People’s Bank of China, which continues to boost its gold reserves—enhancing demand and supporting prices.
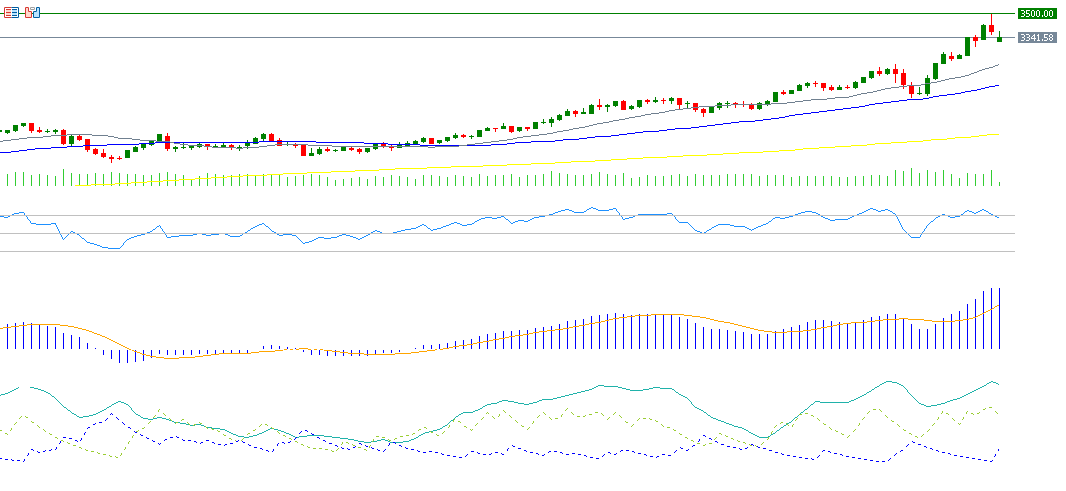
Technical Indicators Point to Further Upside
From a technical perspective, the indicators continue to support the bullish momentum in gold:
- The 20-day, 50-day, and 200-day moving averages are all trending upwards in a healthy pattern, with the 20-day above the 50-day and the 50-day above the 200-day.
- The Relative Strength Index (RSI) is currently at 67, indicating strong bullish momentum.
- The Positive Directional Movement Index (DMI+) stands at around 41 points, while the Negative DMI (DMI-) is at approximately 13 points—signaling strong buying pressure. Notably, the Average Directional Index (ADX) is around 42, which confirms the strength of the current uptrend.
Please note that this analysis is provided for informational purposes only and should not be considered as investment advice. All trading involves risk.


