

How to Draw Fibonacci Retracement Levels in Forex Trading
When a strong Forex market trend starts pulling back, many traders ask the same question: Where could the price reverse before the trend continues? Learning how to draw Fibonacci retracement levels answers that question with precision. This technical analysis tool plots horizontal support and resistance zones directly onto your chart, giving traders a structured, repeatable framework for identifying high-probability entry and exit points.
In this guide, we will explain how to draw Fibonacci retracement levels, which levels traders focus on most, common trading strategies, and mistakes to avoid when using the tool. Whether you trade on MT4 or MT5, the process works in a very similar way.
What Is Fibonacci Retracement and Why Do Forex Traders Use It?
Fibonacci retracement is a technical analysis tool used to identify possible support and resistance levels during a market pullback. When learning how to use Fibonacci retracement, traders draw horizontal levels on a chart to show where the price may pause or reverse before continuing the trend.
The tool is based on ratios from the Fibonacci sequence, a mathematical pattern associated with Leonardo Fibonacci.

Forex traders use Fibonacci retracement for three main reasons:
- Markets move in waves, not straight lines, so pullbacks naturally happen during trends.
- Many traders watch the same Fibonacci levels, which can turn them into important support and resistance zones.
- The tool is built into major trading platforms. On trading platforms like Taurex, the Fibonacci retracement tool is available directly within MT4 and MT5 charts, making it ready to apply across all Forex pairs instantly. This makes it easy to apply across Forex pairs and other markets.
How Do Fibonacci Retracement Levels Work?
Fibonacci retracement works by measuring the distance between a major swing high and swing low on a chart. The tool then places horizontal levels between those two points to highlight areas where the price may pause, reverse, or continue moving.
The tool itself does not predict the market. Instead, it helps traders map out possible support and resistance zones during a pullback.
Swing Highs and Swing Lows
A swing high is a point where the price stops moving up and starts falling. A swing low is where the price stops falling and starts moving higher.
Choosing the correct swing points is one of the most important parts of using Fibonacci retracement properly. The move should be clear and easy to see on the chart, not a small movement inside a sideways range.
In an uptrend, traders draw the Fibonacci retracement from the swing low to the swing high. In a downtrend, they draw it from the swing high to the swing low.
Support and Resistance Zones
Each Fibonacci level can act as a support or resistance zone. In an uptrend, traders watch for support during a pullback. In a downtrend, they look for resistance during temporary rallies.
Price may react, reverse, or move straight through these levels. The most commonly watched levels are 38.2%, 50%, and 61.8% because many traders focus on these areas when looking for potential entries or exits.
How to Draw Fibonacci Retracement Levels Step-by-Step
Drawing Fibonacci retracement levels is simple once you understand the process. The key is staying consistent with how you choose and draw your levels.
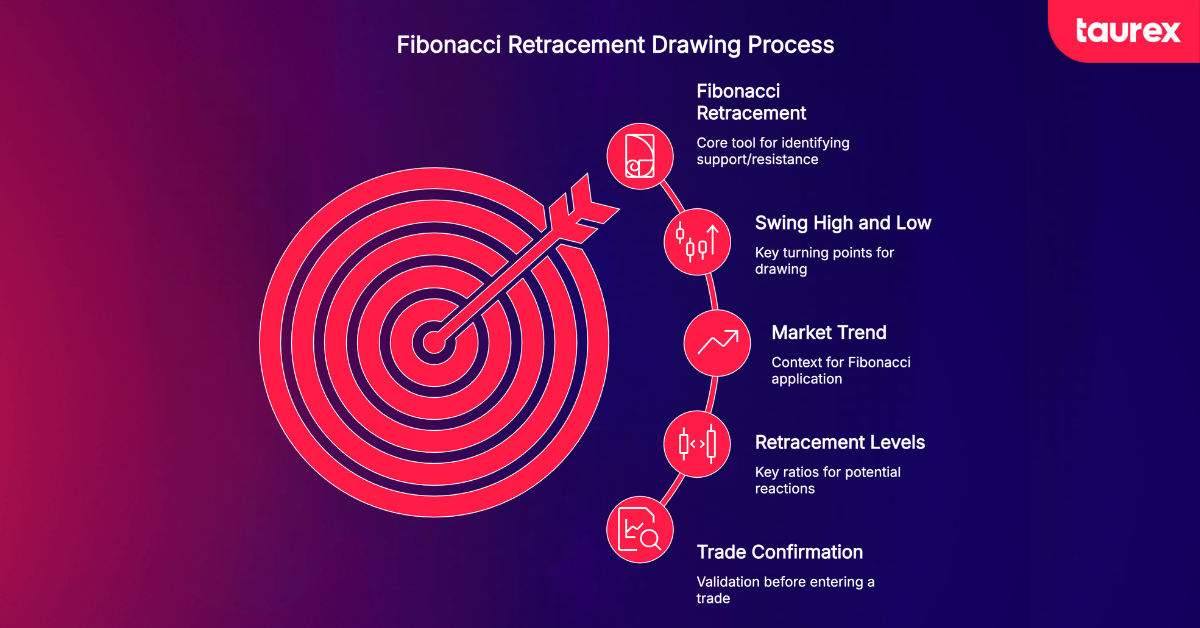
Step 1: Identify the Market Trend
Before using the tool, first confirm the market trend. In an uptrend, price forms higher highs and higher lows. In a downtrend, price forms lower highs and lower lows.
Fibonacci retracement works best in trending markets and is usually less reliable during sideways conditions. Learning how to read charts properly will help you confirm trend conditions before applying Fibonacci.
Step 2: Find the Most Recent Swing High and Swing Low
Next, identify the most important swing high and swing low of the current move. These should be clear turning points on the chart rather than small price fluctuations.
It is also important to stay consistent. If you use candle wicks for one point, use wicks for the other as well.
Step 3: Draw the Fibonacci Tool Correctly
On MT4 or MT5, open the Fibonacci retracement tool and draw it between the two swing points.
- In an uptrend, draw from the swing low to the swing high
- In a downtrend, draw from the swing high to the swing low
The platform will automatically display the main Fibonacci levels on the chart.
Step 4: Watch Key Retracement Levels
Shallow pullbacks often react around 38.2%, while deeper pullbacks may reach 61.8%, which is known as the golden ratio. The 50% level is also widely watched, even though it is not technically a Fibonacci ratio.
Step 5: Confirm the Setup Before Entering a Trade
Do not enter a trade just because the price touches a Fibonacci level. Many traders wait for confirmation from price action or other indicators before entering.
For example, traders may look for candlestick patterns, support and resistance zones, moving averages, or trend lines that align with the Fibonacci level. The more confirmation factors that match, the stronger the setup may become.
How to Draw Fibonacci Retracement in an Uptrend
In an uptrend, a Fibonacci retracement is always drawn from the swing low to the swing high.
The practical process is the following:
- Identify a clear upward move with a visible low and high.
- Place the Fibonacci tool at the swing low (0%).
- Drag it to the swing high (100%).
- The platform will automatically plot the retracement levels between those points.
Traders then watch for the price to pull back into the 38.2% to 61.8% zone before looking for bullish confirmation signals.
In strong trends, the 38.2% level often acts as the first support area. In more moderate trends, the 50% to 61.8% zone is more commonly tested.
How to Draw Fibonacci Retracement in a Downtrend
In a downtrend, the process is reversed. Draw the Fibonacci retracement from the swing high to the swing low. What you need to do is:
- Identify a clear downward move with a visible high and low.
- Place the Fibonacci tool at the swing high (0%).
- Drag it to the swing low (100%).
- The platform will automatically plot the retracement levels above the swing low.
Traders then watch for the price to rally into the 38.2% to 61.8% zone before looking for bearish confirmation signals.
In downtrends, these temporary rallies are often viewed as opportunities for trend-following traders to re-enter in the direction of the main trend.
Best Fibonacci Retracement Levels to Watch in Forex Trading
Not all Fibonacci levels are equally important. Some levels tend to attract more attention from traders and often produce stronger reactions in the market.
- 23.6%: A shallow retracement, often seen in strong, fast-moving trends. It’s less reliable as an entry zone because the price frequently slices through it before any meaningful reaction.
- 38.2%: The first major level worth respecting. In a strong trend, pullback trading strategies often look for early entries here, with this level acting as the first line of defense for the dominant move.
- 50%: Not technically a Fibonacci ratio, but the psychological midpoint of the prior move. Institutional traders frequently use this level for profit-taking and re-entry decisions.
- 61.8% (Golden Ratio): The most statistically reliable level. It represents a deep but still-valid retracement where institutional orders tend to cluster.
- 78.6%: Used in volatile markets with deep pullbacks. If price breaks 61.8% and recovers to 78.6%, it remains a possible reversal zone.
The area between 38.2% and 61.8% is often called the “golden zone” because many traders look for entries within this range. However, Fibonacci levels work best when combined with other tools like price action, RSI, or support and resistance confirmation rather than used alone.
When Fibonacci Retracement Works Best in Forex Markets
Fibonacci retracement works best in strong trending markets where the price is moving clearly in one direction. In sideways or ranging markets, the levels are usually less reliable because there is no clear trend for the price to pull back within.
Higher timeframes like H4, Daily, and Weekly charts often produce cleaner and more reliable Fibonacci levels than very short timeframes such as M1 or M5. Many traders also combine Fibonacci with other tools like moving averages, trend lines, or support and resistance zones to strengthen their setups.
Using multiple timeframes can improve accuracy even further. For example, traders may identify the main trend on the Daily chart and look for Fibonacci entries on H1 or H4.
Fibonacci retracement can become less reliable during major news events or low liquidity market conditions, where volatility may cause prices to ignore technical levels temporarily. Knowing the Forex market hours for your preferred pairs helps you avoid drawing levels during low-liquidity sessions where reactions are unreliable.
Fibonacci Retracement Trading Strategies for Forex Traders
Fibonacci retracement works best when combined with a complete trading strategy rather than used on its own. Below are some of the most common ways Forex traders use it in live markets.
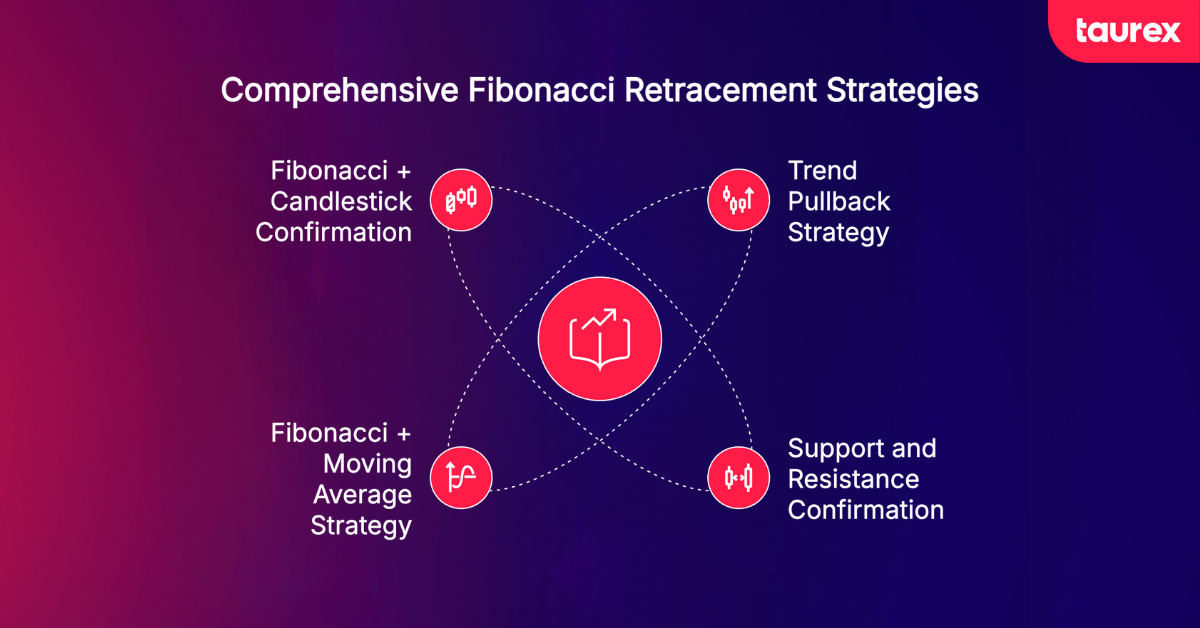
Trend Pullback Strategy
This is the most popular Fibonacci retracement strategy. Traders wait for a strong trend, then look for pullbacks into key levels such as 38.2%, 50%, or 61.8%.
If price shows signs of reversing from one of these levels, traders enter in the direction of the main trend. Stop losses are usually placed beyond the next Fibonacci level or recent swing point.
Support and Resistance Confirmation Strategy
Some traders combine Fibonacci retracement with existing support and resistance zones. When a Fibonacci level overlaps with a previous reaction area on the chart, the setup becomes stronger.
Many traders wait for price action confirmation before entering, such as a strong candle rejection from the zone.
Fibonacci + Moving Average Strategy
Fibonacci levels can also be combined with moving averages like the 50 EMA or 200 EMA. When a moving average lines up with a Fibonacci retracement level, traders often view the area as a stronger support or resistance zone.
This strategy pairs particularly well with major pairs like EUR/USD and GBP/USD, where trend structure is typically cleaner.
Fibonacci + Candlestick Confirmation Strategy
Many traders use candlestick patterns as confirmation before entering a trade at a Fibonacci level.
For example, a bullish engulfing candle or pin bar near the 61.8% level in an uptrend may signal a buying opportunity. In a downtrend, bearish candlestick patterns near a Fibonacci resistance level can signal possible selling opportunities.
Common Mistakes When Drawing Fibonacci Retracement Levels
Fibonacci retracement is simple to use, but many traders still make forex trading mistakes that lead to weak setups and false signals. Avoiding these common issues can improve the quality of your analysis.
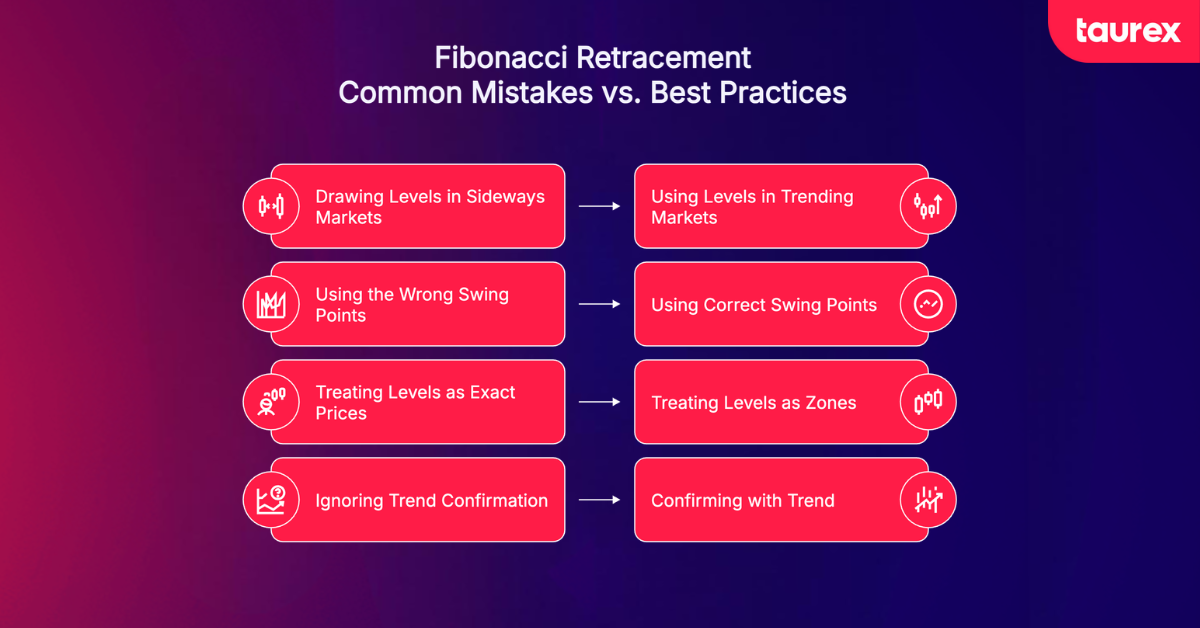
- Drawing Levels in Sideways Markets: Fibonacci retracement works best in trending markets. In sideways or range-bound conditions, the levels often lose their value because there is no clear direction for the price to retrace within.
- Using the Wrong Swing Points: Choosing unclear or minor swing highs and lows can produce unreliable levels. Traders should focus on obvious market moves and stay consistent when drawing from candle wicks or candle bodies.
- Treating Levels as Exact Prices: Fibonacci levels should be viewed as zones rather than exact prices. Price can move slightly above or below a level before reversing, which is normal market behavior.
- Ignoring Trend Confirmation: Some traders enter trades immediately after drawing Fibonacci levels without checking the larger trend. Fibonacci setups are generally more reliable when they align with the market direction on higher timeframes.
Final Thoughts
Developing competence with how to draw Fibonacci retracement levels takes deliberate practice across different pairs, timeframes, and market conditions. A demo account removes financial risk from the learning process while still exposing traders to live market conditions.
On Taurex, traders can use Fibonacci retracement directly on MT4 and MT5 charts, along with access to a wide range of instruments and a demo environment to test strategies safely.
Start practicing your Fibonacci strategies today by opening a free Taurex demo account and testing your setups in real market conditions without risk.
FAQ
What is Fibonacci retracement in Forex trading?
Fibonacci retracement is a technical analysis tool that draws horizontal levels at key ratios like 23.6%, 38.2%, 50%, 61.8%, and 78.6% between a swing high and swing low. These levels highlight possible support and resistance zones where price may pause or reverse during a pullback before continuing the main trend.
How do you draw Fibonacci retracement correctly?
First, identify the trend, then find the most recent clear swing high and swing low. In an uptrend, draw from swing low to swing high. In a downtrend, draw from swing high to swing low. The tool will automatically plot the key levels. Always use clear, obvious swings instead of small price movements.
Which Fibonacci retracement level is most important?
The 61.8% level, known as the golden ratio, is considered the most important. It often acts as a strong pullback zone where the price can resume the trend. The 38.2% and 50% levels are also widely watched by traders.
Does Fibonacci retracement work in Forex?
Yes, but it works best when combined with other tools. Traders often use it with indicators like RSI, moving averages, or candlestick patterns for confirmation. It tends to perform better in trending markets and less effectively in sideways conditions.
What timeframe works best for Fibonacci retracement?
It depends on your trading style. Short-term traders may use lower timeframes like 5-minute or 15-minute charts, while swing traders prefer 4-hour or daily charts. Higher timeframes usually give more reliable signals.
Can beginners use Fibonacci retracement?
Yes. The tool is easy to apply on platforms like MT4 and MT5 available through Taurex. Beginners should start on a demo account, focus on the main levels, and wait for confirmation before entering trades.
What is the golden zone in Fibonacci trading?
The golden zone is the area between the 38.2% and 61.8% levels. Many traders look for entries in this range because pullbacks often end here before the trend continues.
What is the difference between Fibonacci retracement and Fibonacci extension?
Fibonacci retracement measures pullbacks within a trend using two points, while Fibonacci extension projects potential future price targets using three points. Extensions are often used to set profit targets after a retracement has been completed.

