

The Forex market handles around $9.6 trillion in daily trading volume as of April 2025. With so much activity, one of the most common tools traders rely on is the candlestick chart. At first glance, it can look confusing, but experienced traders use it to understand the ongoing balance between buyers and sellers.
Learning how to read candlestick charts in Forex trading is one of the most important foundational skills a trader can develop. Each candle tells a story about market sentiment, momentum, and the balance of control during a specific period. Once you can read that story, patterns become signals, and signals become structured trading decisions.
What Are Candlestick Charts in Forex Trading?
A candlestick chart is a visual way of showing price movement for a currency pair over a specific time period. Each candle shows four key data points: the opening price, the highest price, the lowest price, and the closing price.
Candlestick charts originated in Japan in the 18th century, where rice trader Munehisa Homma studied price movements. He observed that markets are influenced not only by supply and demand but also by trader emotions like fear and greed.
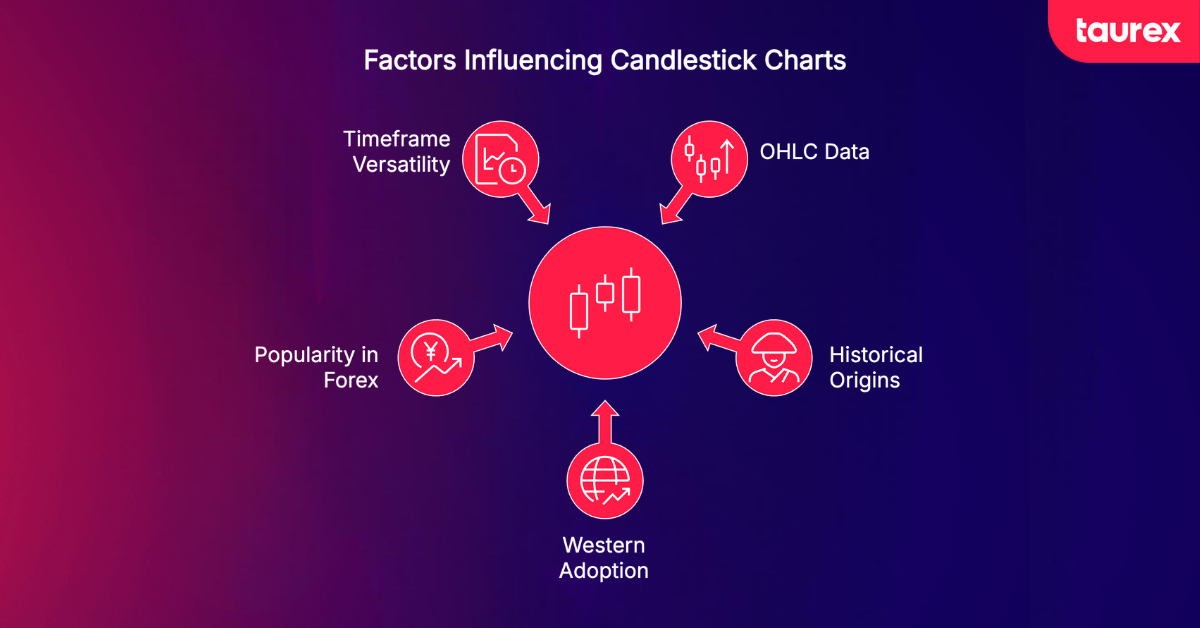
In 1990, Steve Nison helped bring candlestick analysis to Western financial markets, where it quickly became widely adopted.
Candlestick charts are popular in Forex because they show more information than simple line charts. They are the default chart type on platforms like MetaTrader 4 and MetaTrader 5. They are used across all timeframes, from short-term scalping charts to long-term trading analysis.
How to Read Candlestick Charts in Forex Trading Like a Pro
Before you can identify patterns, you first need to understand what a single candlestick is telling you. Each part of the candle shows the balance of power between buyers and sellers during a specific time period. Now let’s learn the main principles of how to read candlestick charts in Forex.
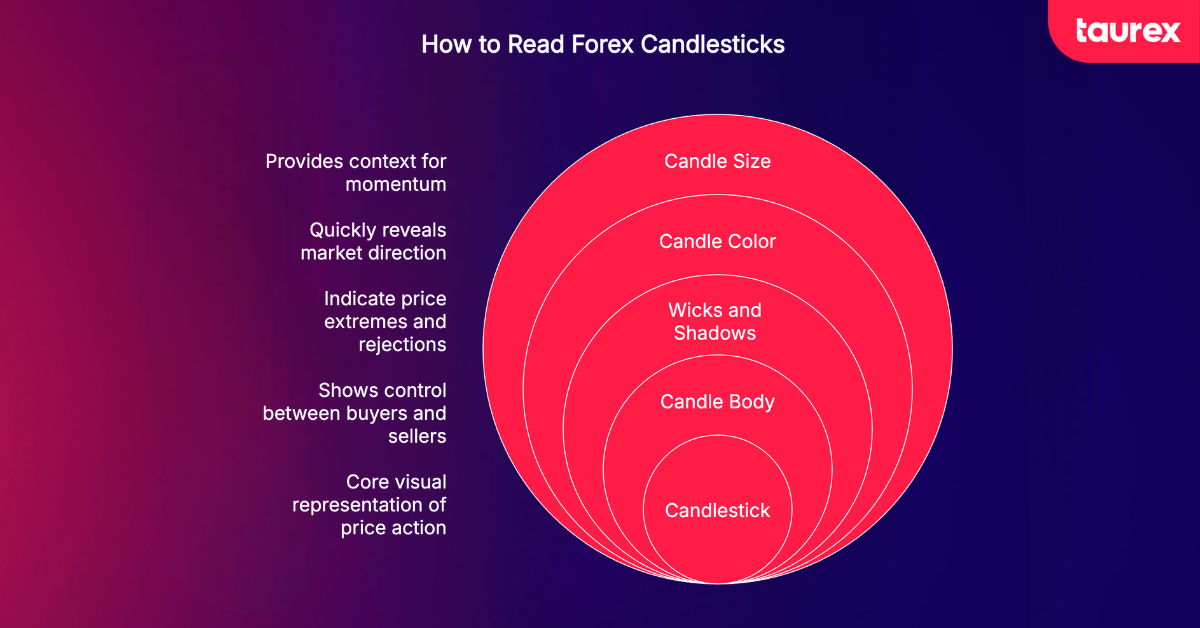
What Is the Candle Body?
The body is the rectangular section between the opening and closing prices. It shows who had control during the session.
- A long body means strong conviction, with buyers or sellers clearly in control.
- A short body shows hesitation, where neither side fully dominated, and the price closed near the open.
- A series of long bodies in the same direction often signals strong momentum in that direction.
What Do Wicks and Shadows Mean?
Wicks, also called shadows, are the thin lines above and below the candle body. They show the highest and lowest prices reached during the period.
- An upper wick shows that the price tried to move higher but was rejected by sellers.
- A lower wick shows that the price dropped, but was pushed back up by buyers.
- A candle with no wick suggests strong momentum, with price moving in one direction without rejection.
- A long upper wick near resistance can signal selling pressure, while a long lower wick near support can show buying strength.
Bullish vs Bearish Candles
Candlestick color quickly shows market direction:
- A bullish candle (usually green or white) closes higher than it opened, meaning buyers were in control.
- A bearish candle (usually red or black) closes lower than it opened, meaning sellers dominated.
This simple visual structure is one reason candlestick charts are preferred over bar charts in Forex analysis.
What Does Candle Size Reveal About Momentum?
Candle size needs context to be meaningful.
- Large bodies with small wicks suggest strong momentum in one direction.
- Small bodies with long wicks show indecision and possible reversals.
- A large candle after several small ones can signal a breakout or momentum surge. This is particularly relevant in strategies like opening range breakout, where the size of the first decisive candle often defines the trade opportunity.
- A small candle after large ones may indicate exhaustion.
Always compare each candle with the ones around it, not in isolation.
Key Forex Candlestick Patterns Every Trader Should Know
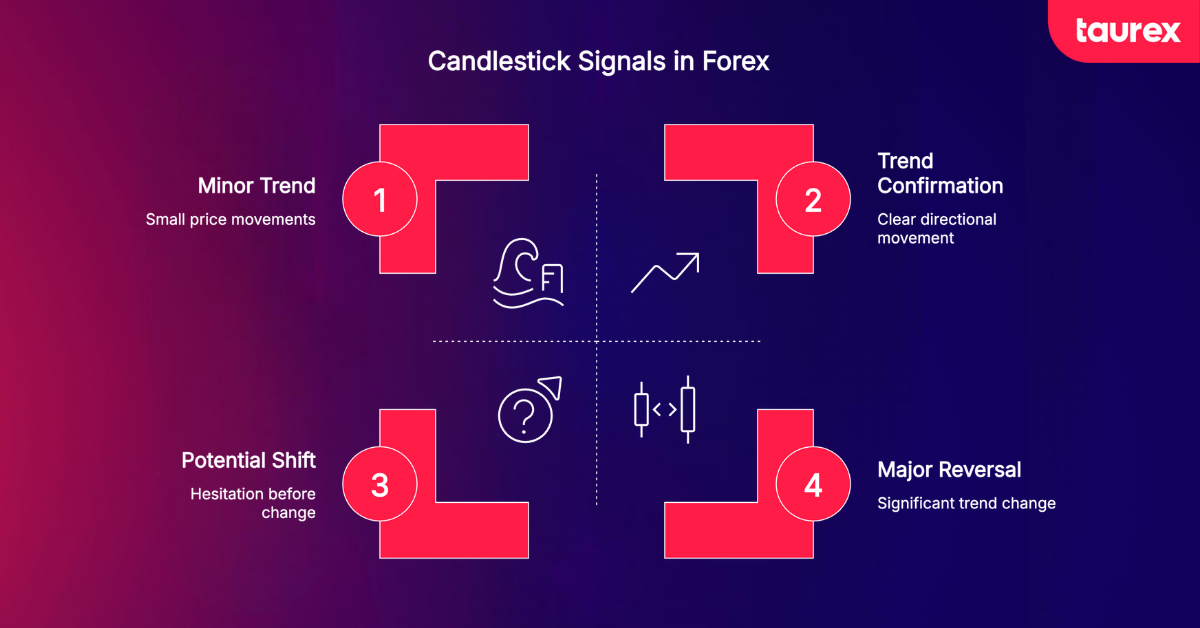
Individual candles provide clues about momentum. Forex candlestick patterns – formations of one, two, or three candles- provide higher-probability signals about potential market direction and sentiment shifts.
The Doji Pattern
One of the key Forex candlestick patterns is the Doji. A Doji forms when the opening and closing prices are almost the same. It shows that neither buyers nor sellers were able to take control during that period. The candle often looks like a cross or a plus sign.
Common types include:
- Standard Doji: small or no body with balanced wicks
- Gravestone Doji: long upper wick with little or no lower wick
- Dragonfly Doji: long lower wick with little or no upper wick
A Doji is most useful when it appears after a strong trend or near key support or resistance levels, where it may signal that momentum is weakening. Doji patterns that form around major economic releases are also worth noting, as they often reflect the hesitation traders feel before acting on Forex news trading strategies.
Hammer and Hanging Man
The Hammer has a small body with a long lower wick and appears after a downtrend. It shows that sellers pushed the price lower, but buyers stepped in and brought it back up, often signaling a potential bullish reversal.
The Hanging Man looks the same but forms after an uptrend. It suggests that selling pressure may be starting to enter the market.
Engulfing Candlestick Pattern
The Engulfing pattern comes in two types:
- Bullish Engulfing: a large green candle fully covers the previous red candle, showing strong buying pressure
- Bearish Engulfing: a large red candle fully covers the previous green candle, showing strong selling pressure
Engulfing patterns are often more reliable when they appear near support or resistance levels and with additional confirmation.
Morning Star and Evening Star
The Morning Star is a three-candle bullish reversal pattern that appears after a downtrend:
- A large bearish candle
- A small, indecisive candle
- A strong bullish candle that closes well into the first candle
The Evening Star is the opposite and appears after an uptrend. Both patterns signal a gradual shift in market control rather than an instant reversal.
Shooting Star Pattern
A Shooting Star has a small body and a long upper wick, forming after an uptrend. It shows that the price was pushed higher but rejected by sellers before closing near the open. It is often seen as a bearish reversal signal, especially when it forms near resistance. When a Shooting Star appears after a gap up at the open, it can overlap with price gap trading strategies, making the rejection signal potentially stronger.
How Candlestick Patterns Signal Market Direction
Understanding how to read candlestick charts in a structured way means grouping patterns by the signals they provide.
Reversal Patterns
Reversal patterns suggest that the current trend may be coming to an end. Common examples include the Hammer (bullish reversal), Shooting Star (bearish reversal), Engulfing patterns, Morning and Evening Star, and Doji formations at key price levels.
These patterns are most reliable when they appear near strong support or resistance zones, where the market is more likely to change direction.
Continuation Patterns
Continuation patterns suggest that the market is pausing before continuing in the same direction. Examples include the Rising Three Methods (bullish continuation) and Falling Three Methods (bearish continuation).
They show that the trend is still intact, even if the price is temporarily slowing down. Traders often use these patterns to add to existing positions in the direction of the trend.
Bilateral Patterns
Bilateral patterns show indecision in the market, meaning the price could move in either direction. Examples include Long-Legged Doji and Spinning Tops.
These patterns often appear during periods of uncertainty or around major news events. They should always be confirmed before taking any trade direction.
How to Use Candlestick Charts in Forex Trading
Reading patterns are only one part of the process. The real edge comes from applying them within a structured analytical framework.
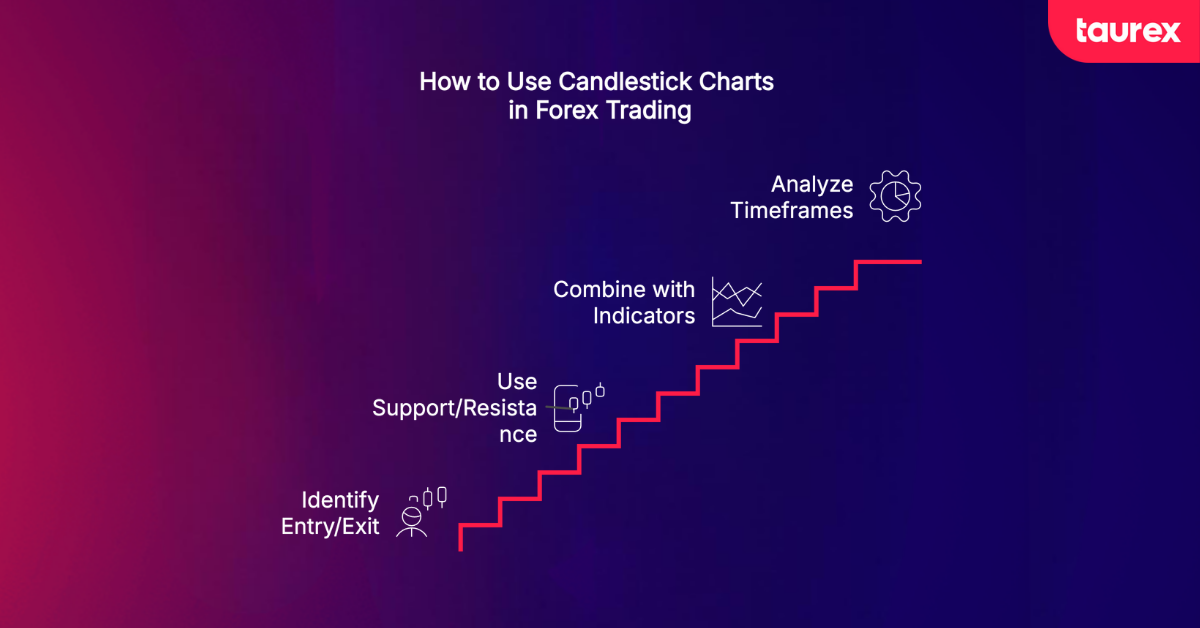
Using Candlesticks With Support and Resistance
A candlestick pattern that forms in open space carries far less weight than one that forms directly at a tested support or resistance level. When the two align a reversal pattern at a key level, the probability of the signal holding increases meaningfully.
Exit signals often come from opposite patterns or signs of weakening momentum, such as a Doji or Shooting Star after a strong move.
A key rule is to always wait for the candle to close before making a decision. Acting mid-candle can lead to false signals because the pattern can change before the session ends.
Taurex traders can mark and annotate these structural levels directly on MT4 and MT5 charts, making it straightforward to monitor when candlestick patterns develop at significant price zones.
Combining Candlestick Analysis With Technical Indicators
Forex candlestick patterns work best when supported by at least one confirming technical tool:
- Moving averages (50 EMA, 200 EMA): Define the trend direction. A bullish candlestick signal above a rising 200 EMA carries more weight than the same signal in a downtrend.
- RSI: Identifies overbought and oversold conditions. A Hammer at support with RSI below 30 is a stronger setup than a Hammer alone.
- MACD: Crossovers confirm momentum shifts that align with candlestick signals.
Finding Entries and Exits With Candlestick Signals
For entries: Wait for the pattern candle to fully close before acting. A candle can change shape significantly before the session ends, and acting mid-candle leads to false signals.
For exits: Watch for opposing patterns or signs of momentum exhaustion. A Doji or Shooting Star after a sustained advance, for example, often precedes a pullback or reversal.
Common Mistakes Forex Traders Make When Reading Candlestick Charts
Even experienced traders can fall into simple traps when reading Forex candlesticks. Avoiding these mistakes helps improve consistency and keeps your analysis more reliable.
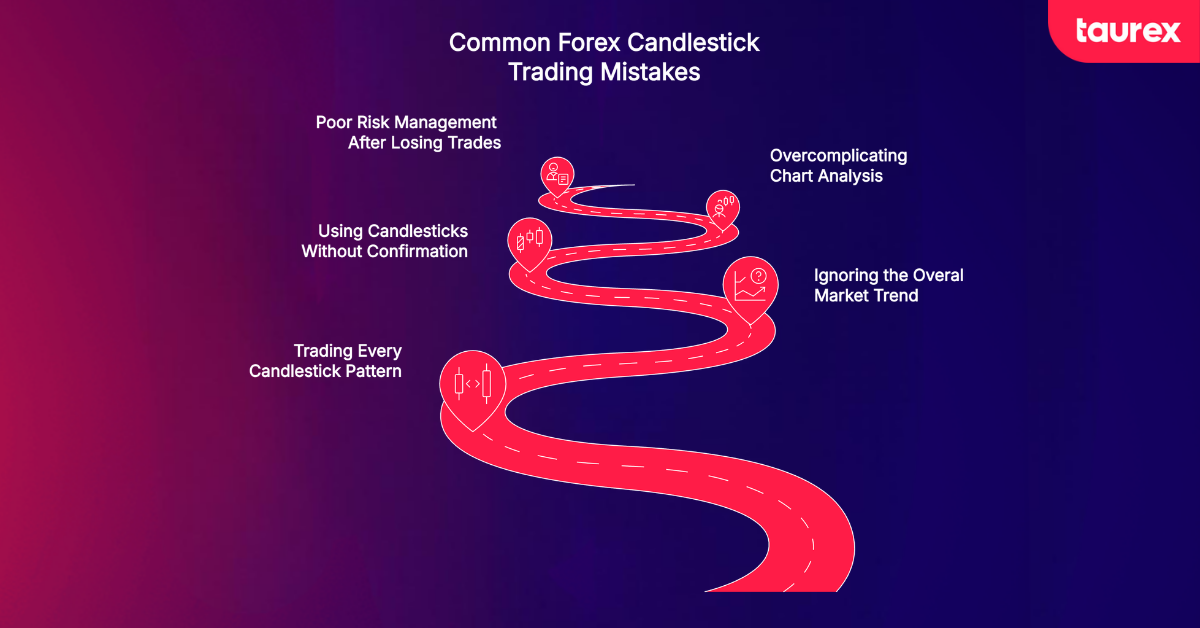
Trading Every Candlestick Pattern
Not every candlestick pattern is worth trading. Many form in low-volume conditions or inside choppy price ranges where there is no clear direction. In these cases, the signal is often weak or misleading.
It is better to focus on quality setups. Look for patterns that form in the right location, align with the trend, and show some form of confirmation. Also factor in trading costs: a wider Forex spread on lower-volume pairs can erode the edge of marginal setups, so only the cleanest patterns are worth acting on.
Ignoring the Overall Market Trend
A bullish reversal pattern in the middle of a strong downtrend is often not a strong signal. The broader trend should always be your first filter, usually from a higher timeframe.
Counter-trend trades can work, but they require stronger confirmation and more careful risk management.
Using Candlesticks Without Confirmation
Entering a trade before a candle has fully closed is a common mistake. Candles can change shape before the session ends, which can turn a valid signal into a false one.
A safer approach is to wait for the candle to close, then look for confirmation from the next candle before entering a trade.
Overcomplicating Chart Analysis
Using too many indicators can create confusion and conflicting signals. This often leads to hesitation and poor decision-making.
Most professional traders keep their charts simple. A clean setup usually includes candlestick patterns, support and resistance, and one or two trend indicators. Simplicity and consistency are often more effective than complexity.
Poor Risk Management After Losing Trades
Even with a solid candlestick setup, losses will occur. One of the most damaging responses is to immediately re-enter the market without a clear signal, trying to win back what was lost. This behaviour, known as revenge trading, often leads to larger losses and can quickly increase Forex drawdown beyond manageable levels. Sticking to your plan and waiting for the next valid candlestick setup is always the more disciplined approach.
Final Thoughts on Reading Forex Candlestick Charts
Candlestick charts are often called the universal language of Forex price action. Learning them is not just about memorising patterns, but about understanding the psychology behind each candle and the constant balance between buyers and sellers.
The strongest trading setups usually combine 3 elements: a clear candlestick pattern, a key price level, and confirmation from another tool. When these factors align, signals become more reliable and easier to act on.
If you are ready to put this into practice, you can use our platform at Taurex to apply what you have learned in real market conditions. We designed Taurex to make chart reading and technical analysis more accessible, with tools that help you track price action, mark key levels, and analyse the market across different timeframes.
It also gives you access to live Forex markets so you can move from theory to practice in a structured way.
Open a demo account with Taurex and test candlestick strategies in real market conditions without risk.
FAQ
How can beginners read candlestick charts in Forex?
Start with the four basic data points: open, high, low, and close. Learn how to identify bullish and bearish candles first, then move on to simple patterns like the Hammer, Doji, and Shooting Star. After that, you can study more complex multi-candle formations. Practising on a demo account is one of the best ways to build confidence without risking real money.
What do candlesticks tell traders?
Candlesticks show the balance of power between buyers and sellers during a specific time period. By displaying the open, close, high, and low, they help traders understand market sentiment and possible future price direction based on how the price behaved.
What is the most important candlestick pattern in Forex?
There is no single most important pattern. However, the Engulfing pattern and the Hammer are often considered strong reversal signals, especially when they form near support or resistance. The Doji is also important because it shows indecision and often appears before major moves.
What timeframe is best for reading candlestick charts?
The 4-hour and daily charts are often preferred for more reliable signals because they contain less market noise. Shorter timeframes like the 15-minute or 1-hour charts are more suitable for day trading but require faster confirmation and decision-making. The best timeframe depends on your trading style and availability.
How accurate are candlestick patterns in Forex trading?
Accuracy varies depending on the pattern and market conditions. Engulfing patterns are often cited in the 50 to 70 percent range, increasing to 60 to 75 percent when confirmed by key levels. Research such as that from Thomas Bulkowski suggests that combining patterns with support and resistance can improve reliability by 10 to 15 percent.
Can candlestick charts predict market direction?
Not with certainty. Candlestick charts do not predict the future, but they help identify probabilities based on past price behaviour and trader psychology. When combined with other tools, they can improve the likelihood of identifying the correct market direction.
What is the difference between bullish and bearish candles?
A bullish candle (green or white) closes higher than it opens, showing that buyers were in control. A bearish candle (red or black) closes lower than it opens, showing that sellers dominated the session.

