
Gold prices recorded a level of $4,498 today, marking a new all-time high, marking a new record level for the 50th time this year, after the yellow metal rose by about 70% from the beginning of the year, posting its best annual performance since 1979. This performance has outpaced high-risk assets such as Bitcoin and most global equity indices, except for South Korea’s KOSPI index, which has risen by around 72%.
Fundamental and technical indicators continue to support gold prices in the coming period, as the key drivers that previously underpinned gold remain firmly in place, most notably:
The persistence of geopolitical tensions between Russia and Ukraine despite ongoing negotiations aimed at ending the war, alongside escalating tensions between the United States and Venezuela, and cautious anticipation of any potential U.S. strike inside Venezuela.
An accommodative monetary policy environment: the U.S. Federal Reserve has delivered three interest rate cuts this year totaling 75 basis points. In addition, the dot plot points to one rate cut next year, while markets are pricing in two cuts. It is also worth noting that Jerome Powell’s term ends in May next year, increasing the likelihood of appointing a Fed chair aligned with Trump, which could lead to a significant reduction in interest rates, potentially down to 1% or 2%. Naturally, this would further support demand for gold, which does not generate yield.
The continuation of gold purchases by global central banks, led by the People’s Bank of China, to increase their gold reserves, which strengthens demand and supports prices.
Investors’ exit from long-term government bonds—such as U.S., British, French, German, and Japanese bonds—which are facing selling pressure and a notable rise in yields due to declining confidence in public finances and widening fiscal deficits. This has pushed investors toward gold as a traditional safe haven.
Inflationary risks remain elevated, as U.S. inflation is still above the 2% target, with expectations of renewed upward pressure next year, reinforcing gold’s role as an effective hedge against inflation.
Notably, gold mining stocks have shown strong positive momentum, outperforming major technology stocks and even gold itself. Shares of Barrick have surged by around 194%, Newmont by approximately 182%, and Agnico Eagle by about 130%.
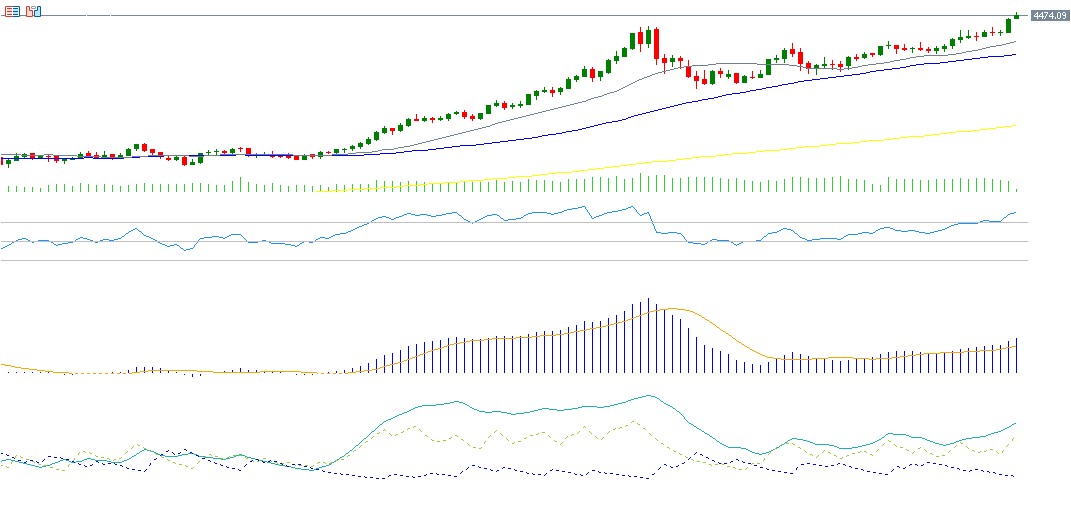
From a technical perspective:
- There is clear alignment in the upward trend of the 20-day, 50-day, and 200-day moving averages, with the 20-day average above the 50-day, and the 50-day above the 200-day, confirming a strong bullish trend.
- The Relative Strength Index (RSI) is currently around 81, placing it in overbought territory and reflecting strong upside momentum in gold prices.
- The positive directional movement indicator (DMI+) stands at around 36, compared with the negative directional indicator (DMI-) at roughly 9. The wide gap between the two signals strong buying pressure. More importantly, the Average Directional Index (ADX) is near 32, indicating that the strength of the upward trend is solid and well established.
Please note that this analysis is provided for informational purposes only and should not be considered as investment advice. All trading involves risk.


