Key Points
- Gold and the US 30 year Treasury yield are both rising at the same time, something that contradicts the traditional inverse relationship between the two. The 30 year yield has surged to 5.272%, its highest level since 2007, while gold sits at $4,338 and climbing. When yields rise, gold typically falls because higher yields increase the opportunity cost of holding a non-yielding asset. That playbook is not working right now.
- This is the second time in twelve months that the correlation has broken down. The first was during the Hormuz crisis in January 2026, when gold surged to its all time high of $5,589 while yields were also climbing above 5%. The implication for VIP members is clear: geopolitical risk premium and sovereign credit concerns are currently overpowering the yield signal, and traders who rely solely on the traditional framework risk being on the wrong side of gold.
The Textbook Relationship
Before we look at what is happening now, let me walk you through how this relationship is supposed to work. Gold is a non-yielding asset. It does not pay interest, dividends, or coupons. When US Treasury yields rise, investors can earn a higher guaranteed return from government bonds, which makes gold relatively less attractive. The opportunity cost of holding gold increases, and capital tends to flow out of precious metals and into fixed income. This is the textbook inverse correlation, and for most of the past two decades it has been a reliable framework.
Look at the left side of the chart. From August through October 2025, you can see this relationship playing out cleanly. When the 30 year yield spiked toward 4.95%, gold stayed pinned near $3,000. As yields pulled back toward 4.65% through October, gold rallied to $3,500. Classic inverse behaviour. If this was all you saw, you would conclude the textbook is correct and move on.
The Overlay
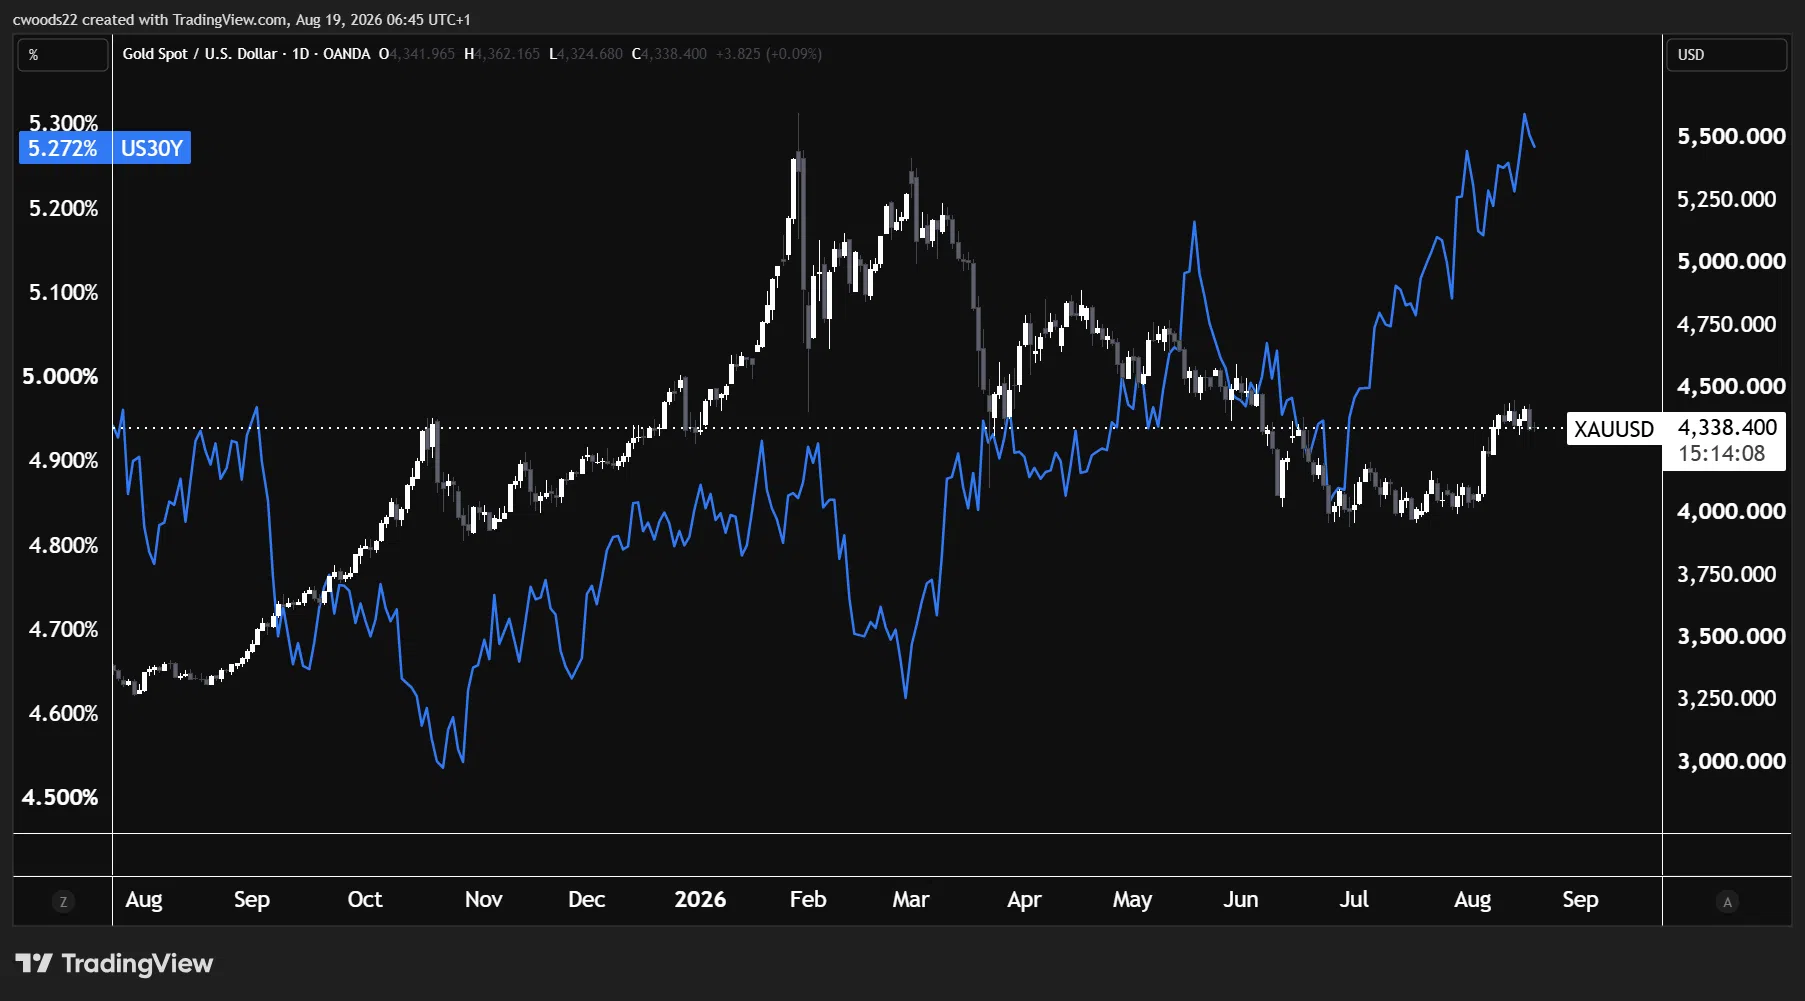
Chart: XAU/USD (candlesticks) vs US 30Y Treasury Yield (blue line), Daily timeframe
The First Break: January 2026
Now look at what happened from November 2025 through January 2026. Gold started rallying from $3,500 toward $4,000, then accelerated violently through December and January, eventually hitting the all time high of $5,589 on January 28th. During this entire move, the 30 year yield was also climbing, pushing from 4.80% to above 5.20%. Both assets rising together. The textbook inverse relationship completely broke down.
The catalyst was the Strait of Hormuz closure. When Iran shut the strait, the market was hit with a genuine geopolitical shock that threatened global energy flows and supply chains. In that environment, gold became a pure crisis hedge. Institutional and sovereign buyers were accumulating regardless of the yield environment because the risk they were hedging against was existential, not cyclical. Central bank gold purchases, which had already been running at record levels through 2024 and 2025, accelerated further. The yield on a 30 year bond is irrelevant when the concern is supply chain collapse and potential conflict escalation.
The Second Break: Right Now
After the Hormuz spike unwound and gold corrected from $5,250 back to the $3,500 area through March, the inverse relationship partially returned during April and May. Yields dipped to around 4.70% and gold consolidated. Normal service appeared to resume.
But look at July and August 2026 on the chart. The correlation has broken again. The 30 year yield has surged from 4.80% to 5.272%, driven by the $25 billion Treasury auction at 5.216% (the highest since 2001), persistent inflation above target, and growing fiscal deficit concerns. Under the old framework, gold should be falling. Instead, gold has rallied from $3,800 to $4,338 over the same period.
Why? Because the drivers have shifted. The same fiscal concerns pushing yields higher are also raising questions about sovereign credit quality and long term dollar purchasing power. When investors worry about government debt sustainability, they buy gold as an alternative store of value. Rising yields are no longer a headwind for gold when the reason yields are rising is that the market is demanding a higher premium to lend to the government. Add the ongoing Hormuz disruption and persistent central bank accumulation, and you have multiple structural forces overriding the cyclical yield signal.
What This Means for Your Trading
The practical takeaway is this: the traditional “yields up, gold down” framework is unreliable in the current environment. If you have been using rising yields as a reason to stay bearish on gold or to fade rallies, you have likely been caught offside. The correlation breakdown is not random noise. It has happened twice in twelve months, both times driven by structural forces (geopolitics, fiscal concerns, central bank buying) that are not going away soon.
That does not mean the inverse relationship is dead permanently. It means the market is telling you that the dominant driver of gold has shifted from yield differentials to risk premium. When that shift reverses, the correlation will return. But until the Hormuz situation resolves, until central banks slow their buying, and until fiscal deficit concerns fade, gold is likely to remain resilient even as yields stay elevated.
For tradiers watching gold setups, the key implication is to stop treating rising yields as automatically bearish. Instead, monitor the 30 year auction results and the fiscal narrative. If yields are rising because of growth optimism and Fed hawkishness, that is bearish for gold. If yields are rising because investors are demanding a higher risk premium to hold US government debt, that is bullish for gold. The same number on the screen can mean entirely different things depending on why it is moving.
Risk Warning: Trading financial instruments, particularly those involving leverage, involves a substantial degree of risk and is not appropriate for all investors. The value of your investments can rise or fall sharply, and it is possible to lose the entirety of your invested capital. Do not trade with funds you cannot afford to lose. Nothing in this site should be read or construed as constituting advice on the part of Taurex or any of its affiliates, directors, officers or employees.