Key Points
- Silver is trading at 63.78, some 16% below its late August high near 76.00, while gold sits at 4,272.26, having pulled back from its own high in a similar timeframe. That divergence in the scale of the two pullbacks has pushed the gold-silver ratio out to roughly 67, near the upper end of where it has traded over the past decade.
- The bull case here is not just ‘gold’s cheaper cousin.’ Silver carries a genuine structural supply deficit, with the Silver Institute forecasting a shortfall of around 67 million ounces in 2026, the sixth consecutive year of deficit, even as industrial demand from electronics, EVs, and AI infrastructure buildout stays firm.
- The chart shows silver and gold moving in near lockstep in direction throughout August and September, both topping out in the same week and both selling off into a demand zone, but at very different magnitudes. That kind of setup, where a smaller and thinner market has moved harder than its larger counterpart, is exactly where traders should be watching for a disproportionate catch-up move.
The Metal That’s Been Left Behind
Every precious metals trader has a view on gold. Fewer have one on silver, and that is despite silver having outpaced gold on the way up for most of this cycle before this month’s pullback hit it far harder. At 63.78, silver is trading well below its August peak, while gold, at 4,272.26, has given back a noticeably smaller share of its own advance over the same stretch.
The result is a gold-silver ratio, the number of ounces of silver it takes to buy one ounce of gold, sitting at roughly 67. That is elevated by the standards of the past ten years, when the ratio has mostly ranged through the 60s and 70s, with the sharpest silver rallies of the past two decades, including the 2011 spike, coinciding with the ratio compressing down into the 30s and 40s. A reading in the high 60s does not guarantee a snap-back, but it is the kind of stretch that has historically preceded silver playing catch-up when it comes.
The Ratio Everyone Quotes vs the Reality
The simple version of the silver bull case is that it is cheap relative to gold and due to close the gap. That is true as far as it goes, but it skips over why the gap opened in the first place. Silver is a dual-purpose metal, part monetary hedge and part industrial input, and that second role means its price also answers to a completely different set of drivers than gold does, chiefly the health of the solar, electronics, EV, and now AI data centre supply chains.
That duality cuts both ways. It means silver can lag gold for genuine reasons tied to industrial demand wobbles or a stronger dollar hitting risk assets broadly, not just because the market is mispricing it. But it also means silver has a second engine gold does not: when investment demand and industrial demand both turn up at the same time, silver’s moves have historically been far larger, in percentage terms, than gold’s. That asymmetry is the real reason traders track the ratio rather than silver’s price in isolation.
Supply: A Sixth Straight Year of Deficit
This is where the structural case for silver becomes genuinely compelling. The Silver Institute is forecasting a deficit of roughly 67 million ounces for 2026, marking the sixth consecutive year that the market has consumed more silver than it has mined and recycled. Global mine supply growth remains modest, in part because roughly three-quarters of silver is produced as a byproduct of mining other metals, chiefly copper, zinc, and lead, so silver supply does not respond quickly even when its own price rises sharply.
On the demand side, the picture is more nuanced than a straight line up. Solar panel manufacturers have been actively reducing the silver loading per cell as silver’s own price has risen, with some Chinese producers substituting copper into parts of the process, which has taken some of the edge off what had been the fastest-growing source of industrial demand. Offsetting that, automotive, data centre, and AI infrastructure-related demand for silver’s conductive and thermal properties has stayed firm and is expected to keep growing through the rest of the decade. Net, the deficit persists even with that substitution effect, which is the more important signal than any single demand category on its own.
Technical Setup
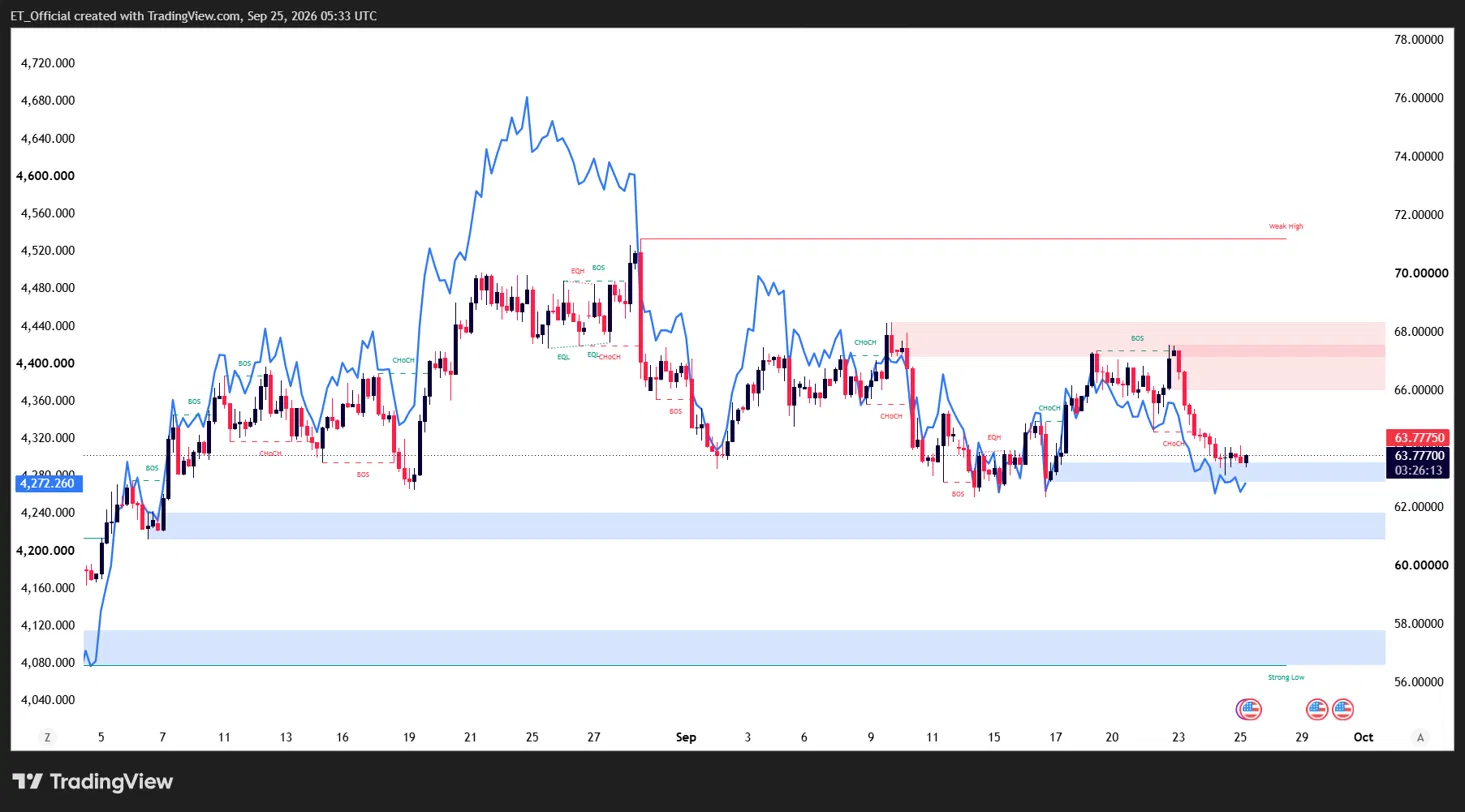
Chart: Silver/USD (candles, SMC) overlaid with Gold/USD (line), Daily timeframe (TradingView)
The Chart: Correlated Direction, Diverging Magnitude
The overlay tells the story at a glance. Silver and gold topped out in the same week in late August, rolled over together, and have spent September grinding lower and consolidating in the same broad windows. Direction-wise, the two have barely diverged all month. Magnitude is a different story: silver broke down from a high above 71.70 and has since carried into the 62.00 to 64.00 demand zone it is now testing, a considerably sharper retracement than gold’s pullback over the same period.
Silver is currently sitting right in that 62.00 to 64.00 zone, with the high above 71.70 marked as the level to reclaim for the broader uptrend to be back in control. A confirmed break below 62.00 would open the door toward a deeper flush, while a hold here, especially alongside any stabilisation or fresh strength in gold, is the kind of setup where silver’s higher-beta nature tends to show up on the way back up as much as it did on the way down.
The read-through is straightforward: this is not a call to fade the correlation, gold and silver are still moving together and likely will keep doing so. It is a call to recognise that when they do turn back up together, the ounce-for-ounce arithmetic of a stretched 67 ratio means silver has historically done the greater share of the moving.
Risk Warning: Trading financial instruments, particularly those involving leverage, involves a substantial degree of risk and is not appropriate for all investors. The value of your investments can rise or fall sharply, and it is possible to lose the entirety of your invested capital. Before engaging in such trading, you must assess your financial goals, experience level, and appetite for risk. It is your sole responsibility to ensure that you understand the mechanics and risks of trading, including margin requirements, and to seek independent financial advice where appropriate. Do not trade with funds you cannot afford to lose. Nothing in this site should be read or construed as constituting advice on the part of Taurex or any of its affiliates, directors, officers or employees.