
Key Points
- The NASDAQ 100 has recovered to 30,225 and is closing in on its all time high after rallying over 30% from the April lows, while Bitcoin at $65,481 remains 47% below its October 2025 peak near $125,000. The correlation that held through all of 2025 has completely broken down in 2026.
- Spot Bitcoin ETF inflows have collapsed to just $536 million year to date, compared to $44.68 billion flowing into equity index funds over the same period. Institutional capital is choosing AI earnings and tech cash flows over speculative momentum, and BTC is paying the price.
- Today’s FOMC decision and Kevin Warsh’s first press conference as Fed Chair will determine whether this divergence widens or snaps back. A hawkish dot plot that pushes rate cuts further out would pressure BTC more than the NASDAQ, while a dovish surprise could be the catalyst that reignites the correlation.
The Chart That Tells the Story
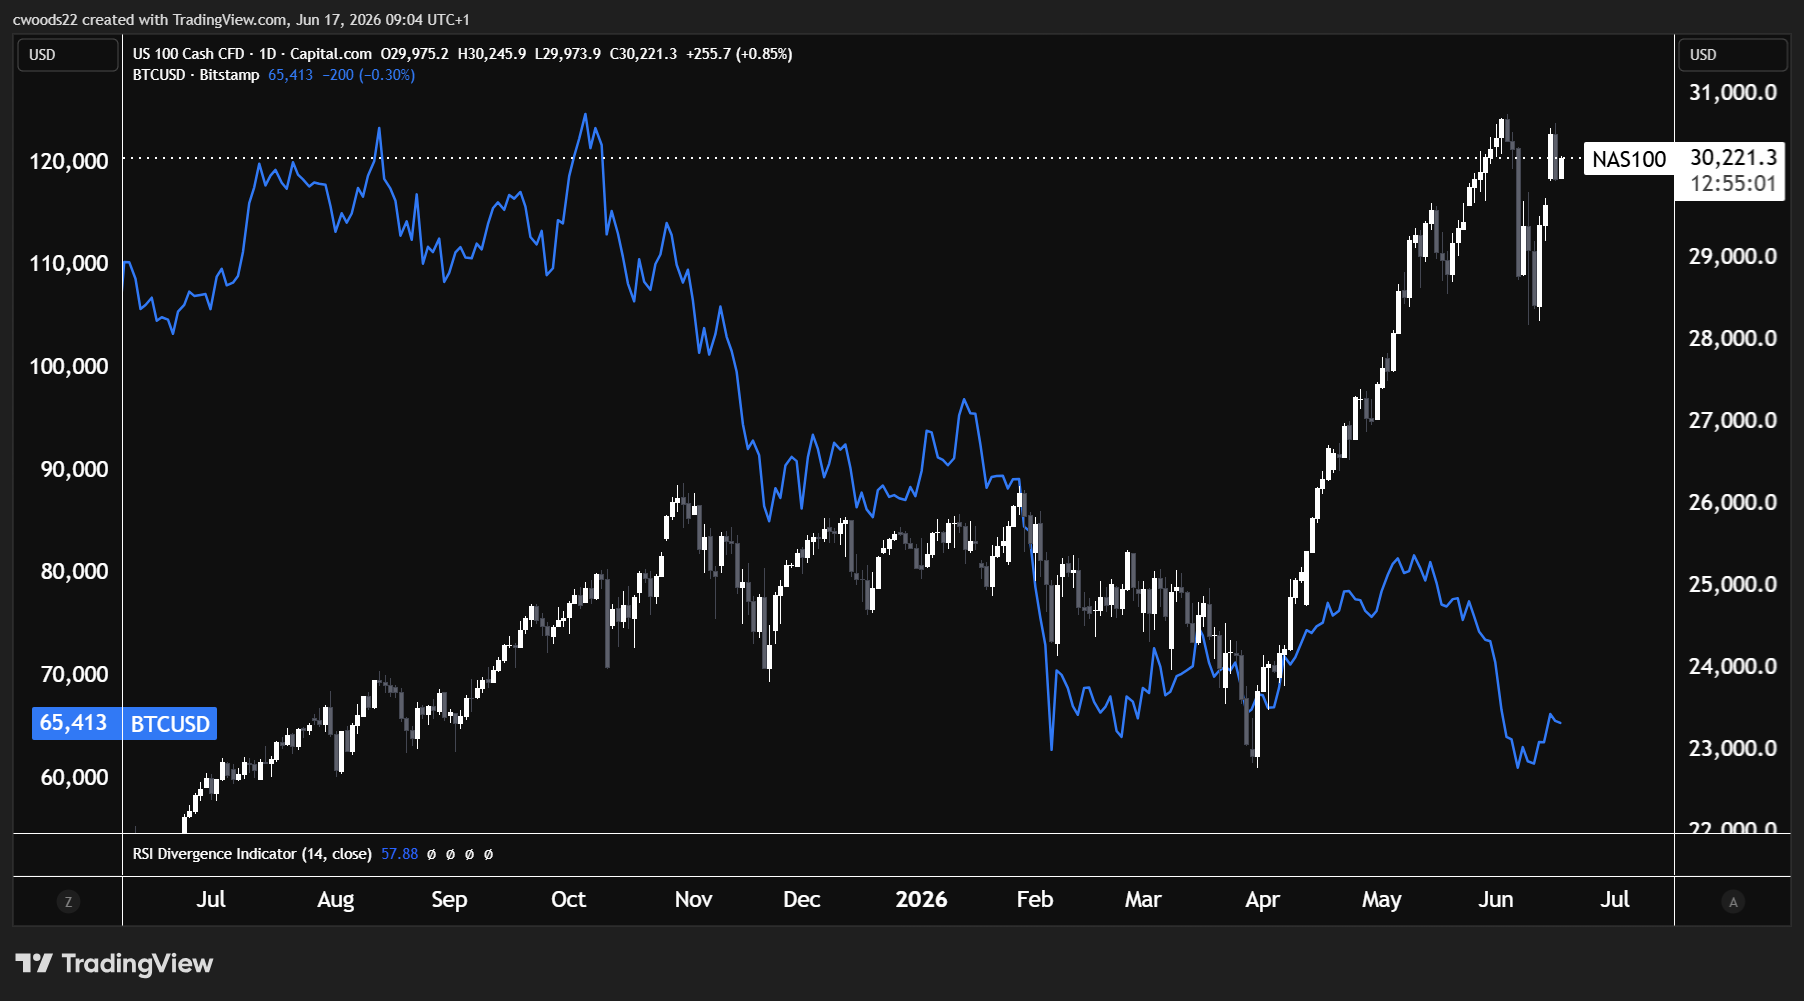
Chart: NASDAQ 100 (candlesticks) vs BTC/USD (blue line), Daily timeframe (TradingView)
The Correlation That Was
The daily chart paints a clear picture in three phases. Phase one runs from July to December 2025, where Bitcoin and the NASDAQ 100 moved in near lockstep. BTC rallied from around $60,000 to its all time high near $125,000 while the NASDAQ climbed from the 22,500 area toward 31,000. The 30 day rolling correlation between the two assets hit 0.74 during this period, meaning they were moving together roughly three quarters of the time. Crypto bulls pointed to this as evidence that Bitcoin had matured into a legitimate institutional asset. It was not just a speculative token anymore, it was a tech sector proxy that amplified the AI and growth narrative.
Phase two was the crash. When the Strait of Hormuz crisis erupted and oil spiked above $100, both assets sold off together. The NASDAQ fell from 31,000 to roughly 22,500 between January and April 2026, while BTC dropped from $125,000 to around $60,000. The correlation held on the way down, which actually reinforced the narrative. Bitcoin was trading like a high beta version of the NASDAQ, falling harder and faster but in the same direction.
Then the Divergence Hit
Phase three is where the chart gets interesting, and where VIP clients should be paying close attention. From April into June, the NASDAQ 100 staged a dramatic recovery. The index has rallied over 30% from the April lows back to 30,225, closing in on the 31,000 all time high. Nvidia’s $81.6 billion quarter was the spark, but the rally was broader than one stock. AI capital expenditure commitments from Microsoft, Meta, Amazon, and Google kept accelerating. The Magnificent Seven collectively added trillions in market capitalisation. The NASDAQ had real, tangible earnings growth to justify the recovery.
Bitcoin did not follow. While the NASDAQ was racing back toward all time highs, BTC has flatlined. It sits at $65,481 today, barely above the crisis lows and still 47% below its October 2025 peak. The 30 day correlation between the two assets collapsed from 0.74 to just 0.10 during May before recovering slightly to around 0.48. The correlation that defined 2025 is no longer reliable, and the divergence is widening with every session.
Why the NASDAQ Recovered and Crypto Did Not
The answer is deceptively simple: the NASDAQ has fundamentals and Bitcoin does not. When tech stocks sell off, they can recover because the companies behind the index generate earnings, cash flows, and are backed by real products and infrastructure spending. Nvidia alone generated more revenue in a single quarter than the entire market capitalisation of most altcoins. Microsoft, Meta, and Amazon are collectively spending hundreds of billions on AI infrastructure, creating a virtuous cycle of revenue growth that feeds directly into stock prices. When institutional money needs to decide where to deploy capital in a high rate, high uncertainty environment, it flows toward assets with verifiable cash generation. The flow data proves this: $44.68 billion has moved into equity index funds year to date, compared to just $536 million into spot Bitcoin ETFs. That is an 83 to 1 ratio.
The rate environment is also doing more damage to Bitcoin than to the NASDAQ. With the fed funds rate at 3.50% to 3.75% and Warsh’s Fed showing no urgency to cut, the opportunity cost of holding a non yielding speculative asset is significant. The NASDAQ’s top holdings still generate earnings yields that compensate investors in this rate environment. Bitcoin’s yield is zero. Retail sentiment data tells the same story. Myfxbook data shows 56% of retail BTC positions are short, meaning even the most speculative segment of the market has lost confidence in the rally narrative.
The FOMC Catalyst
Today’s FOMC decision and Kevin Warsh’s first press conference as Fed Chair will be decisive for both assets, but the impact will not be symmetrical. A rate hold is 97.4% priced in, so the decision itself is not the event. The focus is on the updated dot plot and Warsh’s forward guidance. If the dot plot shifts hawkishly and pushes the first rate cut further into 2027 or signals openness to another hike, it would likely widen the divergence. The NASDAQ can absorb higher rates because AI earnings are growing fast enough to compensate. Bitcoin cannot, because it has nothing to offset the higher cost of capital.
A dovish surprise would be the opposite scenario, and potentially the catalyst that brings the correlation back. If Warsh signals that the tightening cycle is definitively over and rate cuts are on the table for later this year, speculative assets would benefit disproportionately. BTC could see a sharp squeeze given the current short positioning, while the NASDAQ would extend gains from already elevated levels. In that scenario, Bitcoin’s higher beta would work in its favour for the first time in months.
The levels to watch: for Bitcoin, $60,000 is the floor from the crisis lows. A break below that on a hawkish surprise would confirm the structural decoupling and point toward $52,000 to $55,000. On the upside, $72,000 to $75,000 is the first meaningful resistance where the downtrend from the October highs intersects. For the NASDAQ 100, the all time high near 31,000 is the next target. A clean break would confirm the rally has further to run, while a rejection from the 30,000 to 30,500 area would suggest the index needs a pullback to consolidate before making another push.
Risk Warning: Trading financial instruments, particularly those involving leverage, involves a substantial degree of risk and is not appropriate for all investors. The value of your investments can rise or fall sharply, and it is possible to lose the entirety of your invested capital. Do not trade with funds you cannot afford to lose. Nothing in this site should be read or construed as constituting advice on the part of Taurex or any of its affiliates, directors, officers or employees.