
Last week, U.S. stock indices saw a broad-based decline, with the S&P 500 falling by 2.61% and the Nasdaq 100 down 2.39%, following four consecutive weeks of gains.
However, U.S. equity futures rose for the second consecutive day, driven by signs of easing trade tensions between the United States and the European Union. Former President Donald Trump announced the postponement of 50% tariffs on the EU from June 1 to July 9 after a phone call with the President of the European Commission. Trump also stated that talks with Iran were “good,” boosting investor sentiment and U.S. stock markets.
Despite this rebound, heightened volatility continues to dominate the markets. The Volatility Index (VIX) rose to 25.50 points on Friday, May 23, marking its highest level in about two weeks. Uncertainty across trade, geopolitics, economic data, and fiscal and monetary policy — especially in the U.S. — is expected to keep volatility elevated in the near term.
Factors Pressuring U.S. Stock Markets:
- Moody’s downgrade of the U.S. credit rating from AAA to Aa1.
- Trump’s threat to impose 25% tariffs on Apple products manufactured outside the U.S., warning CEO Tim Cook that iPhones should be made in the U.S. instead of in China, India, or elsewhere.
- Worrisome fiscal data:
- U.S. national debt has surpassed $36 trillion.
- Debt-to-GDP ratio stands at 124.3%.
- Budget deficit is 6.8% of GDP, with the last federal surplus recorded in 2002 (+2.6%).
- Debt service costs amount to 3.7% of GDP.
- Trump’s criticism of Walmart, urging the company to stop blaming tariffs for higher prices.
- Renewed attacks on Federal Reserve Chair Jerome Powell, calling for interest rate cuts.
- A sharp drop in U.S. consumer confidence, now at its second-lowest level in history, alongside rising inflation expectations.
Factors Supporting U.S. Equities Going Forward:
- Receding recession risk, with the probability of a U.S. recession this year falling from 65% to 38%.
- Strong bullish sentiment among traders, with the call-to-put options ratio reaching 1.7 — the highest level since December 2024.
- Positive outlooks from major banks such as Morgan Stanley and Wells Fargo, both recommending buying U.S. equities.
- Anticipated Gulf investment inflows into the U.S. economy, including:
- $1.4 trillion from the UAE.
- $1.2 trillion from Qatar.
- $600 billion from Saudi Arabia.
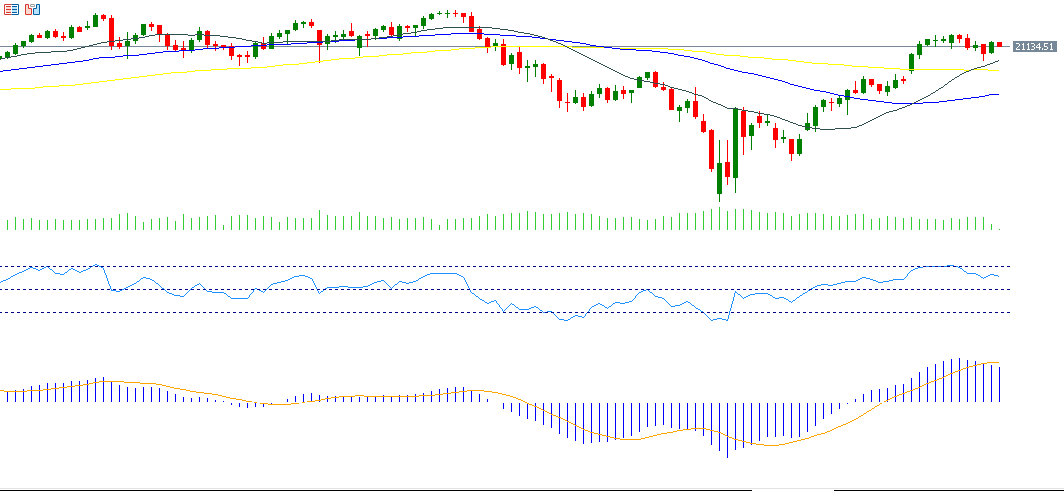
Technical Analysis: Nasdaq 100
The Nasdaq 100 fell 2.39% last week and is down 0.50% year-to-date.
- The Relative Strength Index (RSI) is currently at 60, suggesting bullish momentum.
- The MACD indicator shows a bullish crossover above the signal line, reinforcing positive momentum.
- The key technical challenge lies in breaking above the resistance level at 21,483 points.
Please note that this analysis is provided for informational purposes only and should not be considered as investment advice. All trading involves risk.


