
Crude oil prices have fallen for the third consecutive month. Since the beginning of August, prices have continued to trade within a narrow range between $60 and $70 per barrel and are currently hovering around $65, amid uncertainty dominating the oil market due to mixed factors. Oil prices have declined by about 14% since the start of the year.
The main factors weighing on crude oil prices include:
• The announcement by the OPEC+ alliance of an oil production increase, starting in December, by 137,000 barrels per day.
• Ample oil supply from countries outside the OPEC+ group.
• Weak recent economic data from major oil importers such as China, which has pressured global oil demand.
On the other hand, the positive factors currently supporting oil prices include:
• Ongoing geopolitical tensions between Russia and Ukraine, as well as between the United States and Venezuela.
• The U.S. imposing new sanctions on Russian oil companies “Rosneft” and “Lukoil,” the country’s largest producers, which together account for half of Russia’s crude exports. The move aims to pressure Moscow into negotiating a peace agreement with Ukraine.
• The U.S. Department of Energy’s announcement to begin purchasing one million barrels to refill the Strategic Petroleum Reserve.
• A decline in U.S. crude oil inventories by 6.858 million barrels recently, lower than both the expected -0.900 million barrels and the previous reading of -0.961 million barrels.
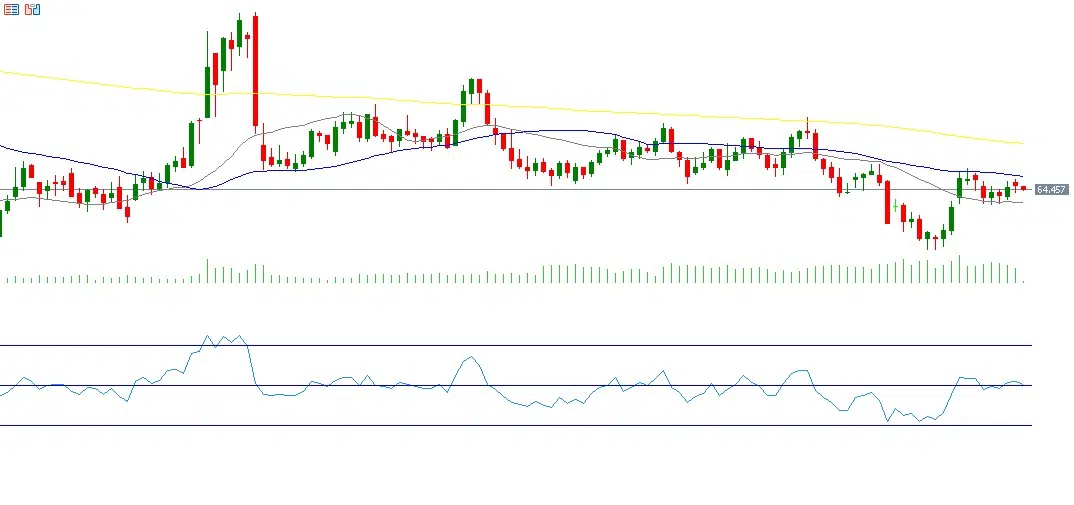
From a technical perspective, crude oil prices are currently trading above a key support level — the 20-day moving average (gray line) at $63.72. The next challenge is whether prices can break above the 50-day moving average (blue line) at $65.70 and subsequently reach the resistance level represented by the 200-day moving average (yellow line) at $68.25.
As for the Relative Strength Index (RSI), it currently stands at 50 points, indicating a neutral trend.
Please note that this analysis is provided for informational purposes only and should not be considered as investment advice. All trading involves risk.

