Location & Language

Taurex Global Limited regulated by the Financial Services Authority (FSA) of Seychelles (SD092)

Technical Indicators and UK Data Push FTSE 100 Toward Record Highs

Author:

Taurex

The UK’s FTSE 100 index rose to 8,887 points yesterday, marking its highest level since March 3, 2025. The index has gained approximately 18% from the April 7, 2025 low of 7,533 points to the recent peak. It has also risen about 9% year-to-date, outperforming U.S. indices such as the S&P 500 and Nasdaq 100. However, it still lags behind other European benchmarks like Germany’s DAX and the STOXX Europe 600.

The FTSE 100’s recent rally is attributed to several key factors:

  • Wage Growth and Labor Market Data: Total earnings including bonuses fell to 5.3%, below expectations (5.5%) and the previous reading (5.6%). Unemployment rose slightly to 4.6%, in line with expectations but higher than the prior 4.5%, suggesting a higher likelihood of monetary easing (rate cuts) from the Bank of England.
  • Optimism Around US-China Trade Talks: Ongoing negotiations in London between the U.S. and China have boosted market sentiment.

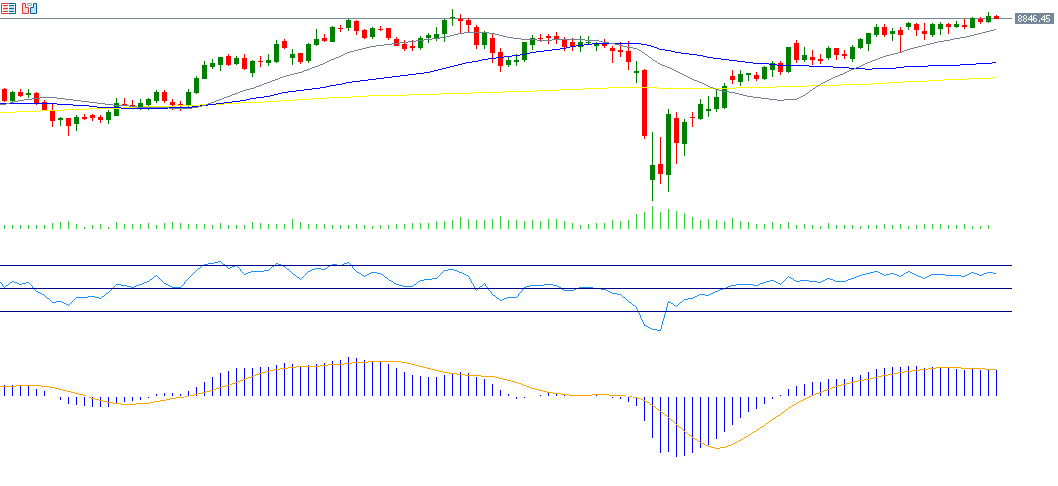
On the technical side, indicators support continued bullish momentum for the FTSE 100:

  • The 20-, 50-, and 200-day moving averages are trending upward, with the 20-day above the 50-day, and the 50-day above the 200-day average — a classic bullish alignment.
  • The Relative Strength Index (RSI) currently stands at 62, reflecting positive momentum.
  • The MACD indicator shows a bullish crossover, with the MACD line moving above the signal line, further supporting the upside outlook.

The main challenge now lies in breaking the record high of 8,909 points set on March 3, 2025.

Please note that this analysis is provided for informational purposes only and should not be considered as investment advice. All trading involves risk.

Back

Taurex
Taurex brings a new perspective to trading - your confidence is our benchmark.
With a safe and secure trading ecosystem, diverse range of assets, comprehensive education, and advanced trading tools, Taurex empowers you to trade with confidence.

On this page

Ready for more?
Move to Taurex today

Popular Posts

Under the Microscope: Palladium Edition

Coffee & Charts with Connor: The Oil and CAD Correlation Is Lying to...

Trade Radar: Gold Trapped, S&P Coils, and GBP/JPY Fires Off Demand

Week Ahead with Connor Woods: Warsh Takes the Reins as FOMC Minutes and...

Here are some related articles you may find interesting:

Market Insights​

May 21, 2026

Under the Microscope: Palladium Edition

Key Points Palladium has fallen 37% from its January high of $2,200 to $1,386 and the daily chart structure is firmly bearish, with multiple Break...

Market Insights​

May 20, 2026

Coffee & Charts with Connor: The Oil and CAD Correlation...

Key Points The traditional inverse correlation between crude oil and USD/CAD has broken down repeatedly since the Hormuz crisis began, with both assets moving in...

Market Insights​

May 19, 2026

Trade Radar: Gold Trapped, S&P Coils, and GBP/JPY Fires Off...

Key Points Gold is trapped beneath a descending trendline and the $4,740 to $4,760 supply zone. A rejection from trendline resistance near $4,620 to $4,640...

Market Insights​

May 18, 2026

Week Ahead with Connor Woods: Warsh Takes the Reins as...

Key Points The FOMC minutes from Powell's final meeting land on Wednesday, revealing how deeply the committee was split when it voted 8 to 4...

Ready to Elevate Your Trading Journey?

Open a Taurex account and start trading today.

Chat on WhatsApp

Live account Registration

1 Hour Trading Consultation

This site is registered on wpml.org as a development site. Switch to a production site key to remove this banner.