Key Points
- The FOMC held rates at 3.50% to 3.75% on Wednesday in a divided 9 to 3 vote, with three regional bank presidents dissenting in favour of a hike. EUR/USD rallied to 1.14800 on the relief that rates were unchanged, then pulled back to 1.14377. The demand zone at 1.13800 is where three bull RSI divergences confirmed buying interest earlier in the week, and the pullback toward that level offers an entry for a move back toward the 1.14800 high. Today’s Core PCE (forecast 0.1% month on month, down from 0.3%) is the next catalyst: a soft print would weaken the dollar further and push EUR/USD toward the target.
- Amazon reports Q2 earnings after the close today. The stock has already corrected 3.4% from $234 to $226 on broader tech weakness and FOMC uncertainty, and two bull RSI divergences at the lows suggest the selling has exhausted. AWS cloud growth of 31% to 33% year on year is the key metric, with analysts at Bank of America forecasting the high end on the back of demand from AI workloads. A beat on AWS would likely send the stock back toward the $232 to $234 supply zone.
- USD/JPY is trading at 163.71 after rallying from the 163.30 lows back to the 163.95 supply zone. Two bear RSI divergences at the highs suggest the rally is overextended, and the supply zone near 163.90 to 163.95 has capped every push higher this week. The Bank of Japan meets tomorrow and Tokyo Core CPI (released tonight, forecast 1.8% versus 1.6%) will set the tone. A hot CPI print gives the BoJ cover to hike, which would trigger yen strength and send USD/JPY toward the 163.30 lows and potentially the 163.00 level below.
Trade 1: EUR/USD Long from Demand
| Pair | Direction | Entry Zone | Target 1 | Target 2 | Invalidation |
| EUR/USD | Long | 1.13800 to 1.14000 | 1.14500 | 1.14800 | Below 1.13600 |
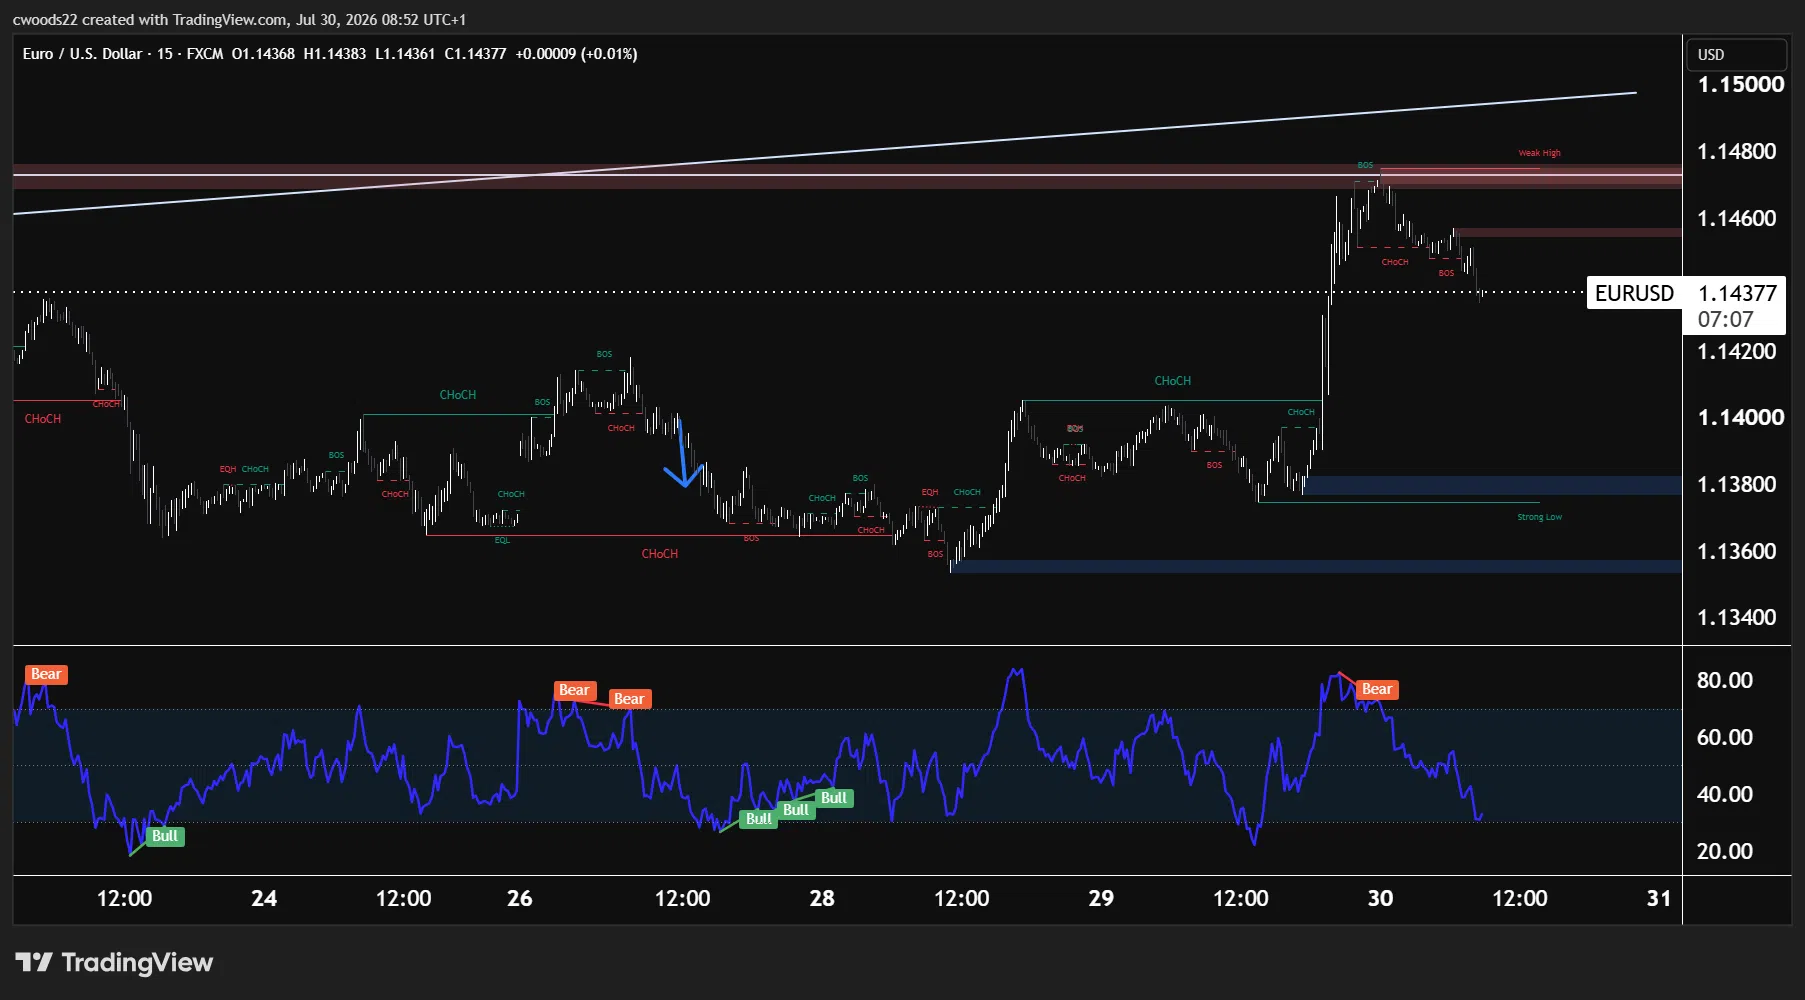
Chart: EUR/USD, 15min timeframe (TradingView, SMC)
The Federal Reserve held rates at 3.50% to 3.75% on Wednesday evening in what Chair Warsh described as a “family fight.” The vote was 9 to 3, with three regional bank presidents (Hammack, Kashkari, and Logan) dissenting in favour of a 25 basis point hike. That three members wanted to raise rates is hawkish on the surface, but the bottom line is that Warsh held the majority and rates are unchanged. Markets currently price two hikes before the end of 2026, so the dissents were not entirely unexpected.
EUR/USD rallied sharply on the decision, pushing from the 1.13800 demand zone to tag 1.14800 before pulling back. The move was driven by relief that the Fed did not hike, combined with a slightly softer tone in the statement regarding economic activity.
The 15 minute chart tells a clean structural story. Three bull RSI divergences at the July 27 to 28 lows confirmed that selling pressure had exhausted in the 1.13600 to 1.13800 demand zone. The recovery from there was impulsive, with a series of bullish change of character and break of structure signals driving price through 1.14000, 1.14200, and up to 1.14800. That high is the target: it sits just below a descending trendline and represents the liquidity that the chart structure suggests will be swept.
The pullback to 1.14377 is constructive. A bear RSI divergence at the Jul 30 high is a short term warning, but the broader structure remains bullish as long as the 1.13800 demand holds. The entry zone is 1.13800 to 1.14000, which is the confirmed demand area where the bull divergences sit.
Today’s Core PCE reading is the catalyst. The forecast is 0.1% month on month, down from 0.3% in the prior period. This is the Fed’s preferred inflation measure, and a print at or below expectations would undercut the case for the hawks who wanted to hike on Wednesday. That would weaken the dollar further, push EUR/USD through 1.14500, and set up the sweep of the 1.14800 high. If Core PCE surprises higher (0.2% or above), the hawkish dissents gain credibility and the dollar strengthens, putting the 1.13800 demand under pressure.
Trade 2: Amazon (AMZN) Long into Earnings
| Pair | Direction | Entry Zone | Target 1 | Target 2 | Invalidation |
| AMZN | Long | $228.50 to $230.00 | $232.00 | $234.00 | Below $226.00 |
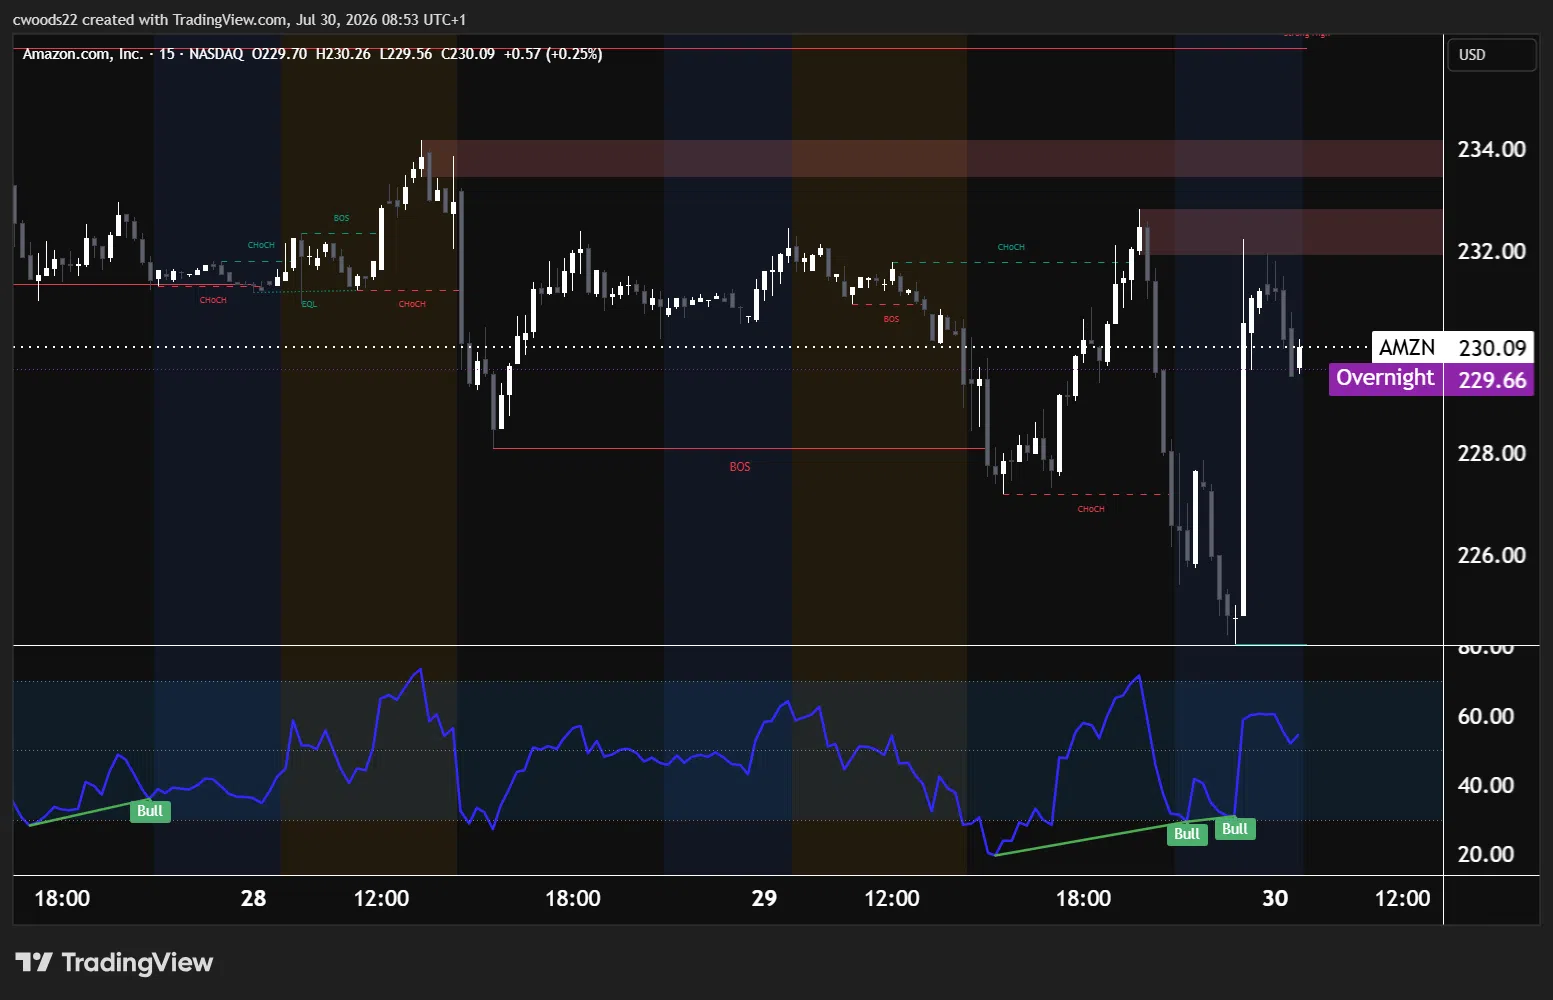
Chart: Amazon (AMZN), 15min timeframe (TradingView, SMC)
Amazon reports Q2 2026 earnings after the close today, and the setup on the 15 minute chart is worth watching regardless of whether you trade the stock directly. The broader tech sector has been under pressure since last week when Tesla and Alphabet both disappointed, with Tesla’s EPS coming in at $0.33 versus the $0.49 expected and Alphabet posting negative free cash flow for the first time in its history.
Amazon’s stock has absorbed some of that negative sentiment. From the $234 level at the start of the week, price sold off to $226 on the back of the FOMC decision and general risk-off positioning ahead of earnings. The 15 minute chart shows that sell off clearly, with a bearish break of structure at $228 and a change of character bearish at $228 confirming the shift in control from buyers to sellers.
The recovery from $226 is where the opportunity sits. Two bull RSI divergences at the lows confirm that the selling pressure has exhausted. Price made lower lows while the RSI printed higher lows, a classic signal that a reversal is forming. The stock has climbed back to $230 and is now sitting just below the overnight level at $229.66.
The demand zone is $228 to $230, where the structural shift occurred. The supply zones sit at $232 and $234, representing the areas where sellers previously took control. The entry zone is $228.50 to $230.00, the current area and any dip back toward the confirmed bull divergence level.
The earnings themselves will determine the direction. Revenue is expected at $197 billion (up 18% year on year) and EPS at $1.82. But the number that matters most is AWS. Analysts expect cloud revenue growth of 31% to 33% year on year, an acceleration from the 28% growth rate in Q1. Bank of America has the high end of that range, citing demand from AI workloads including Anthropic and OpenAI. If AWS delivers 33% or better, the AI capex spending narrative shifts from “companies are spending too much” to “companies are spending and getting returns.” That would lift the entire tech sector, not just Amazon.
The risk is free cash flow. Amazon’s FCF collapsed 95% year on year in Q1 to just $1.2 billion as capital expenditure surged 52% to $32.9 billion. If Q2 FCF is negative (following Alphabet’s lead), the market may punish the stock regardless of what AWS does. The invalidation below $226 accounts for a full earnings miss scenario.
Trade 3: USD/JPY Short from Supply
| Pair | Direction | Entry Zone | Target 1 | Target 2 | Invalidation |
| USD/JPY | Short | 163.85 to 163.95 | 163.30 | 163.00 | Above 164.05 |
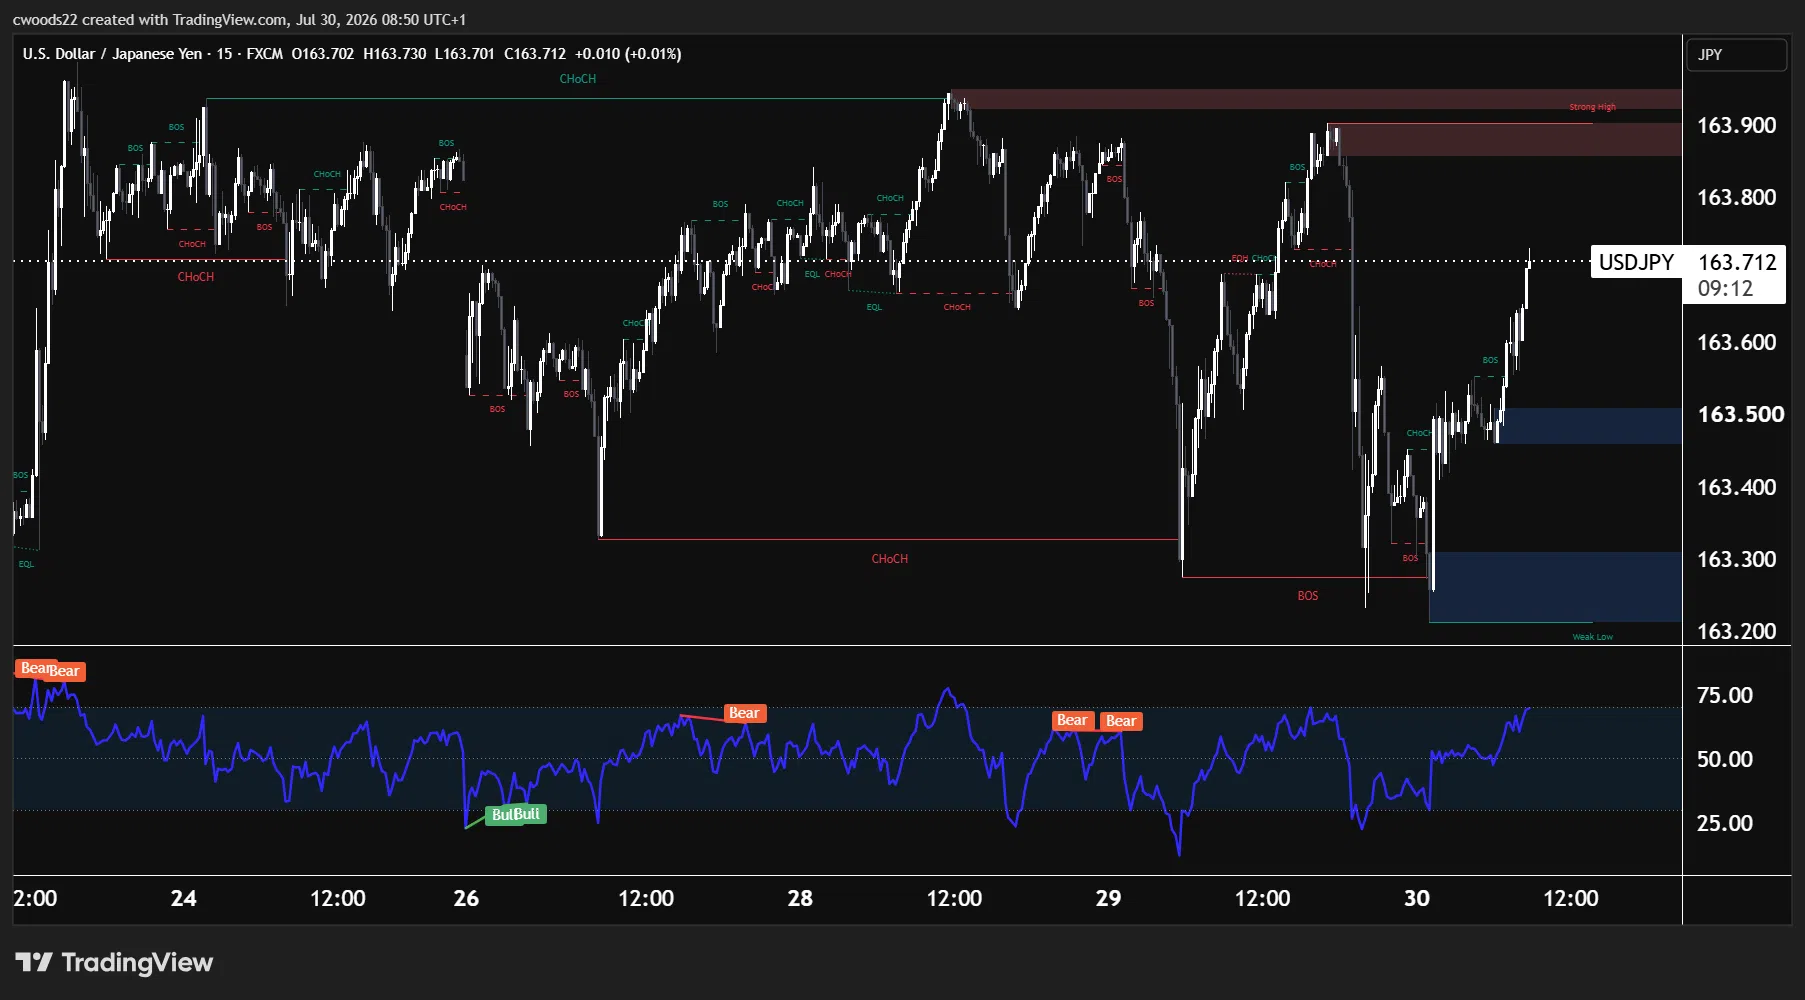
Chart: USD/JPY, 15min timeframe (TradingView, SMC)
USD/JPY is the most event driven trade on the radar this week. The pair is trading at 163.71, near a 40 year high for the dollar against the yen, and the Bank of Japan meets tomorrow morning (Friday, 02:30 UTC) for what could be the most consequential rate decision of the year.
The backdrop is straightforward. The Fed is at 3.50% to 3.75%. The BoJ is at 1.00%. That 275 basis point gap makes the carry trade (borrowing in yen, investing in dollars) extremely attractive, and it has been the dominant driver of USD/JPY’s rally from 160.50 in mid June to the current level. 87% of retail traders are positioned short on the pair, betting on yen strength, but so far the carry trade has overwhelmed every attempt to fade the move.
The 15 minute chart shows the recent price action. After the FOMC decision on Wednesday, USD/JPY dropped sharply to 163.30 as the dollar weakened on the hold. The bearish break of structure at 163.30 confirmed that sellers had taken control briefly. But the recovery was equally sharp: price rallied back through a series of bullish change of character signals to tag the 163.90 to 163.95 supply zone, which is marked by the chart’s highest structural level.
Two bear RSI divergences sit at the July 29 highs near 163.90. The rally from 163.30 to 163.90 came on fading momentum, meaning each push higher produced weaker RSI readings. The supply zone at 163.85 to 163.95 has capped every attempt to break higher this week. That combination of supply resistance and bearish divergence creates the short setup.
The entry zone is 163.85 to 163.95, the supply area. The first target is 163.30, the low from the FOMC reaction where the break of structure occurred. That level represents liquidity that the chart suggests will be revisited. The extended target is 163.00, a round number and the level where intervention rumours are most likely to intensify. Invalidation sits above 164.05, where a break above the structural high would suggest the carry trade is extending further and the BoJ decision has been priced as a hold.
Tokyo Core CPI releases tonight (23:30 UTC) and is forecast at 1.8% year on year, up from 1.6%. If that prints at or above forecast, it gives Governor Ueda cover to either hike at tomorrow’s meeting or signal firmly that a hike is coming in September. Either outcome would strengthen the yen. The risk is that the BoJ sounds cautious and does nothing to challenge the carry trade, in which case USD/JPY pushes above 164.00 and the trade is invalidated.
Japan’s Ministry of Finance spent ¥11.7 trillion on currency intervention earlier this year, and while it had limited lasting effect, the threat of another round at these elevated levels adds a layer of downside risk for USD/JPY bulls.
Key Events Today and Tomorrow
Thursday 30 July: BoE Rate Decision (11:00 UTC) | US GDP Q2 Advance (12:30 UTC) | Core PCE m/m (12:30 UTC) | Tokyo Core CPI (23:30 UTC) | Apple and Amazon earnings (after US close)
Friday 31 July: BoJ Rate Decision (02:30 UTC) | BoJ Press Conference (05:30 UTC) | Eurozone CPI Flash (09:00 UTC)
View our economic calendar here for the full schedule of events and their potential market impact.
Risk Warning: Trading financial instruments, particularly those involving leverage, involves a substantial degree of risk and is not appropriate for all investors. The value of your investments can rise or fall sharply, and it is possible to lose the entirety of your invested capital. Do not trade with funds you cannot afford to lose. Nothing in this site should be read or construed as constituting advice on the part of Taurex or any of its affiliates, directors, officers or employees.