
Since the beginning of this week and through yesterday, U.S. economic indicators have been disappointing. This includes the labor market, with declines in both job openings and the ADP private sector employment report, as well as economic growth, where GDP contracted by 0.3% in Q1 2025. This figure is below both expectations (0.2%) and the previous reading (2.4%), marking the first contraction in three years. The decline came as companies rushed to increase imports ahead of Trump’s proposed tariffs.
Inflation indicators also showed weakness. The Core Personal Consumption Expenditures (PCE) Price Index — which excludes food and energy — rose by 2.6%, in line with expectations but lower than the previous reading of 3%.
Moreover, consumer confidence continued to decline for the fifth consecutive month, hitting its lowest level in five years. The goods trade deficit also widened significantly in March.
As a result, these negative data points may prompt the Federal Reserve to consider rate cuts in the near future. Markets are currently pricing in four rate cuts for this year. The Fed is widely expected to keep interest rates unchanged at its upcoming meeting on May 7, but all eyes are on Fed Chair Jerome Powell’s tone and remarks, especially given the increasingly complex economic outlook.
On one hand, Powell remains cautious and concerned about potential inflationary pressures stemming from tariffs. On the other hand, the clear slowdown in the U.S. economy is raising fears of an impending recession. These concerns are further reinforced by an inversion in the yield curve between the 3-month and 10-year U.S. Treasury bonds, with the spread currently at -15 basis points.
Adding to the complexity is the ongoing political pressure from President Trump on Powell, with repeated calls in his speeches for the Fed to lower rates immediately, claiming the central bank is lagging behind.
Despite some calm and optimism regarding upcoming negotiations between the Trump administration and several countries — particularly China — uncertainty still dominates this front. Therefore, all these factors combined contribute to heightened uncertainty, fueling continued market volatility.
April witnessed sharp fluctuations in U.S. equity markets. The Volatility Index (VIX) surged to 60 points on April 7, 2025, before dropping to 24 points as of yesterday. Volatility is expected to remain elevated in the near term.
Despite this, U.S. major equity indices closed yesterday with broad gains, including the S&P 500, Nasdaq 100, and Dow Jones. The S&P 500 rose for the eighth consecutive session, reaching 5,659 points — its highest level since April 2, 2025 — and marking a 17% increase from the April 7 low of 4,835 points.
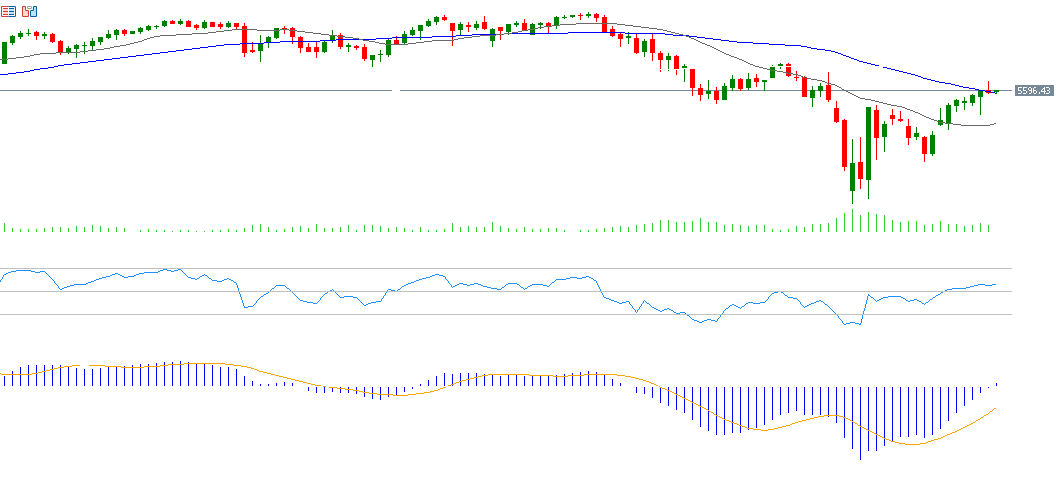
Technical Analysis:
The S&P 500 has broken above the 50-day moving average at 5,592 points. The current key challenge is to reach the record high for the year, at 5,676 points.
- The Relative Strength Index (RSI) currently stands at 57, indicating positive momentum for the S&P 500.
- The MACD indicator shows a bullish crossover between the blue MACD line and the orange signal line, supporting the continuation of upward momentum.
Please note that this analysis is provided for informational purposes only and should not be considered as investment advice. All trading involves risk.


