



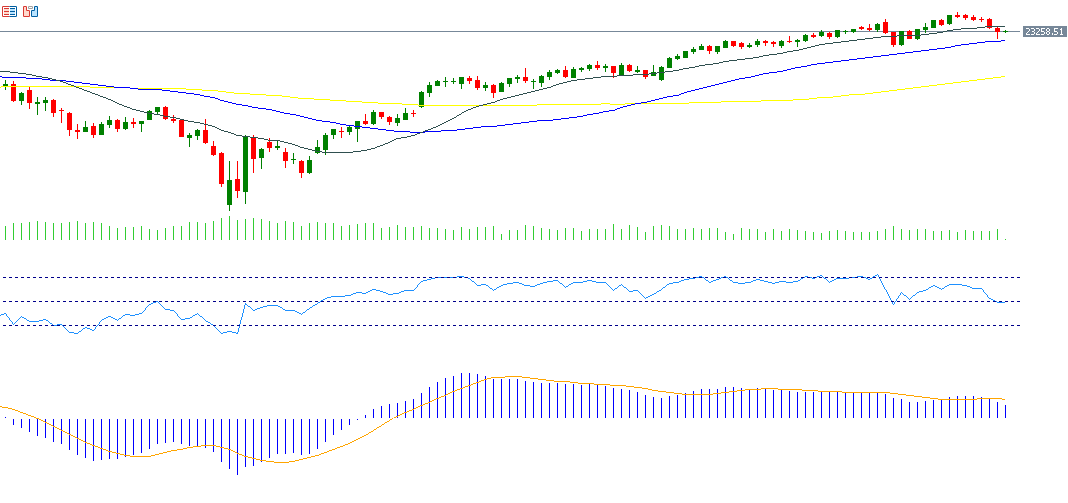
U.S. indices, particularly the S&P 500 and Nasdaq 100, continued to decline notably for the second consecutive session, following last week’s record highs. The S&P 500 reached 6,481 points on Friday, August 15, while the Nasdaq 100 hit 23,969 points on Wednesday, August 13.
Yesterday, both indices closed lower, with the S&P 500 ending at 6,396 points and the Nasdaq 100 at 23,250 points.
Meanwhile, the CBOE Volatility Index (VIX), also known as the “fear gauge,” rose to 17.19 yesterday, its highest level in two weeks, reflecting investor unease and uncertainty surrounding U.S. equities at the moment.
Several factors appear to be weighing on U.S. indices, including:
- The notable decline in shares of the AI-linked tech giants known as the “Magnificent 7.”
- Nasdaq 100 valuations reaching their highest levels since 2021.
- Nasdaq 100 price-to-sales ratio hitting a historical peak.
- Ongoing uncertainty regarding U.S. monetary policy.
Markets are now closely watching Federal Reserve Chair Jerome Powell’s upcoming speech at the Jackson Hole symposium on Friday, where he may hint at the possibility of resuming rate cuts. This comes amid a clear divide among Fed members regarding a potential September rate cut.
U.S. Treasury yields also retreated across the curve. The 2-year yield — the most sensitive to Fed policy — stood at 3.75% yesterday, while the 10-year yield — more affected by Treasury’s fiscal policy — reached 4.29%.
It’s worth noting that falling yields imply rising bond prices, as Treasuries remain a safe-haven asset for investors amid ongoing uncertainty over U.S. monetary, fiscal, and trade policies.
Markets fear the U.S. economy could slide into stagflation, especially with expectations that tariffs may negatively impact growth while inflation risks remain elevated — complicating the Fed’s decision-making on the path of interest rates ahead.
Technical Analysis:
Technical indicators suggest negative pressure on the Nasdaq 100 in the near term due to the following:
- Relative Strength Index (RSI): Currently around 49, signaling weak positive momentum and leaning toward bearishness.
- MACD Indicator: The blue MACD line is below the orange signal line, reinforcing continued downside momentum.
- Directional Movement Index (DMI): The DMI+ is around 24 compared to the DMI- at about 31, showing a wide gap that reflects strong selling pressure.
- Average Directional Index (ADX): Currently around 27, indicating a well-established bearish trend.
Please note that this analysis is provided for informational purposes only and should not be considered as investment advice. All trading involves risk.



