Key Points
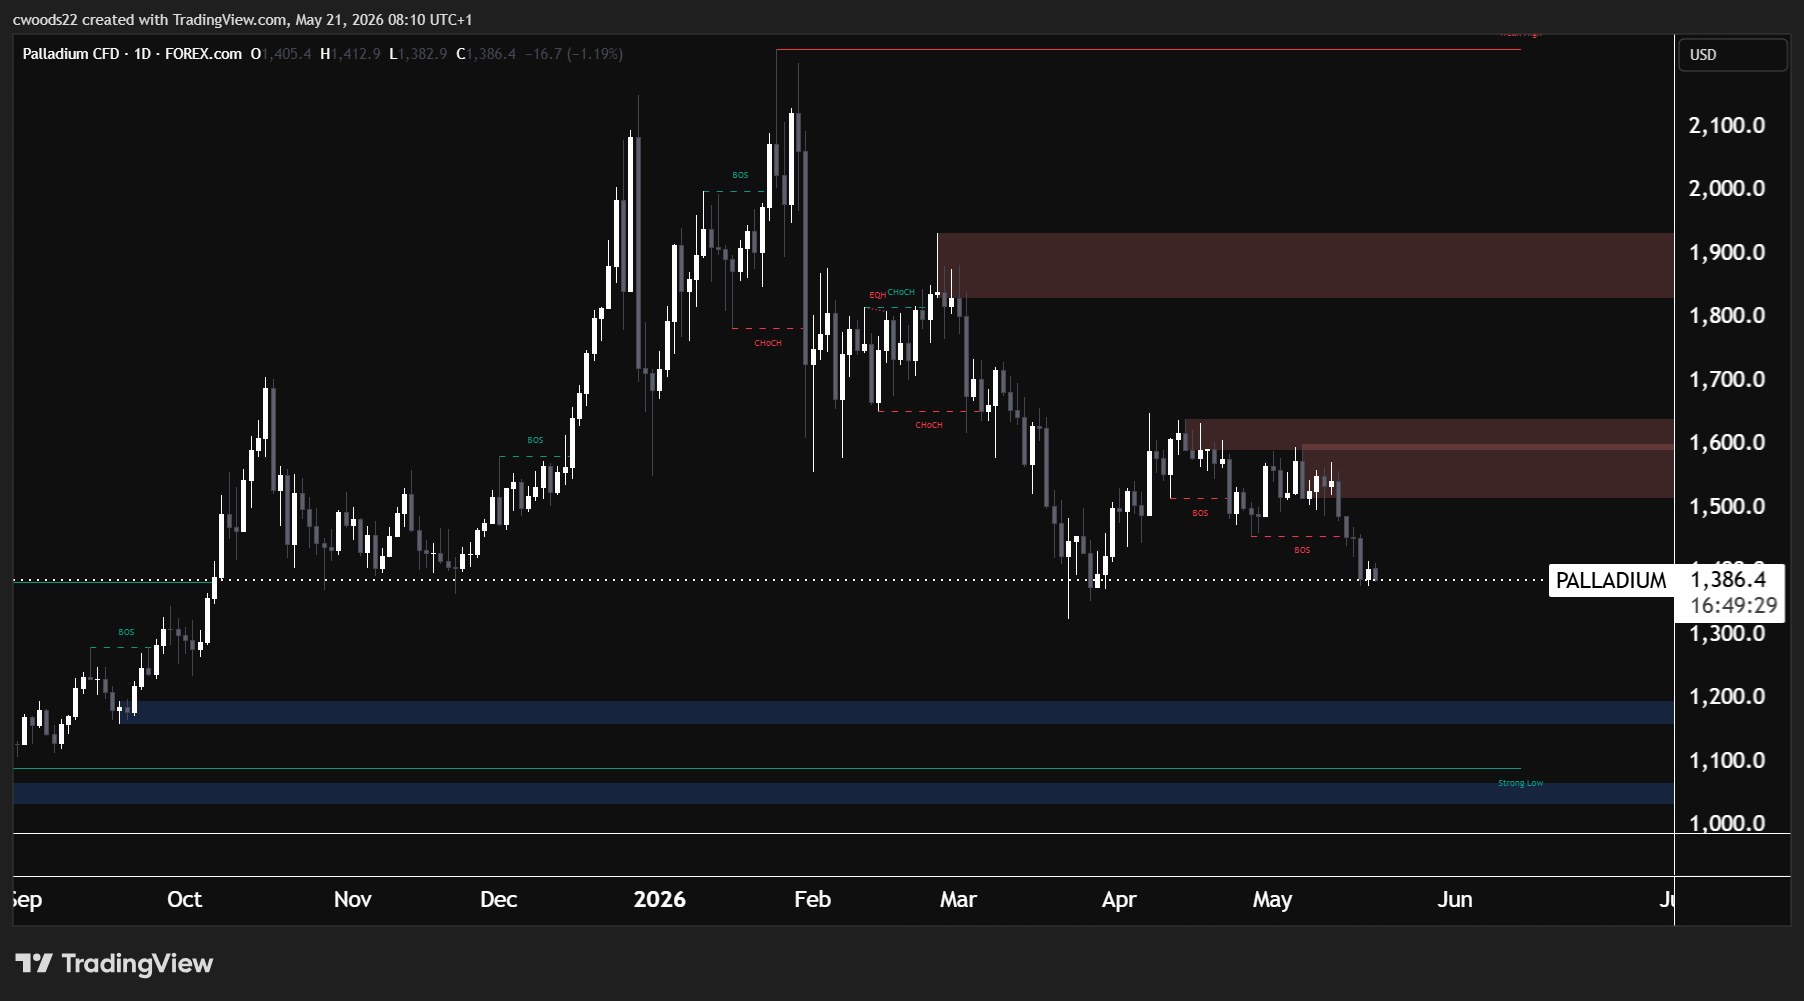
- Palladium has fallen 37% from its January high of $2,200 to $1,386 and the daily chart structure is firmly bearish, with multiple Break of Structure confirmations and two Change of Character shifts on the way down.
- The fundamental picture is shifting: after running structural deficits from 2012 to 2024, the palladium market is projected to post its first surplus in over a decade in 2026 at around 214,000 ounces. But tighter emissions standards and the hybrid vehicle boom could delay that surplus.
- The $1,150 to $1,200 demand zone on the daily chart is the level that matters. If it holds, it sets the stage for a potential re-accumulation. If it breaks, the Strong Low near $1,050 comes into play and the entire rally from July 2025 is unwound.
The Technical Picture
From $1,050 to $2,200 and Back Again
The daily chart tells a story in two acts. Act one: palladium carved out a Strong Low near $1,050 in July 2025, with equal lows (EQL) forming a clean base. From there, a relentless rally took price through multiple Break of Structure (BOS) levels, past $1,200, $1,500, and eventually to $2,200 by January 2026. That peak is labelled as a Weak High on the chart, and that label matters. In Smart Money terms, a Weak High suggests the move higher was not driven by strong institutional commitment at the top, meaning there is unfinished business above that level if buyers ever regain control.
Act two has been brutal. Since January, price has fallen 37% in a controlled distribution. The first Change of Character (CHoCH) around $1,800 was the warning shot, signalling the bullish trend was in trouble. A second CHoCH near $1,650 confirmed the structural shift. Since then, BOS after BOS has printed on the way down through $1,500 and $1,440, with each failed bounce being sold into. The most recent BOS near $1,440 marked the latest lower low, and price is now sitting at $1,386 with little in the way of visible support until the $1,150 to $1,200 demand zone.
The Zones That Matter
Two supply zones are clearly marked on the daily chart. The first sits at $1,550 to $1,600, where the most recent CHoCH formed and sellers stepped in aggressively. Any bounce into this zone is likely to face immediate selling pressure. The larger supply zone at $1,850 to $1,950 represents the major distribution area from March. Price would need to reclaim this zone to have any chance of shifting the bearish structure, and that looks unlikely in the near term.
On the demand side, the $1,150 to $1,200 zone is the key level. This blue zone on the chart represents the area where the original rally accelerated in September and October 2025. It is the last line of defence before the Strong Low near $1,050. If palladium reaches this zone and holds with a convincing reaction, it could set the stage for a re-accumulation phase. If it fails, the entire 2025 rally is unwound and the market is repricing a structurally different fundamental picture.
The Fundamental Regime Change
This is what makes palladium so interesting right now. The metal ran structural supply deficits every single year from 2012 to 2024. The shortfall peaked at 910,000 ounces in 2023 and narrowed to around 416,000 ounces in 2025. But according to Johnson Matthey’s latest PGM market report, 2026 is projected to be the first surplus year in over a decade, at roughly 214,000 ounces. That is a seismic shift for a market this small, and it explains a lot of the selling pressure on the chart.
But the surplus narrative has cracks in it. On the demand side, 85% of palladium consumption comes from automotive catalytic converters, and two forces are working in palladium’s favour. First, the EV adoption curve has flattened. Hybrid sales are surging instead, and hybrids use 10% to 20% more palladium per vehicle than a standard internal combustion engine because their engines cycle on and off more frequently, spending more time in cold start conditions where the catalyst works hardest. Second, emissions standards are tightening globally. Euro 7 in Europe, China 7 in Asia, and EPA Tier 4 for US heavy duty trucks from 2027 are all increasing the palladium loading required per vehicle.
On the supply side, the picture is equally fragile. Russia and South Africa account for 75% of global palladium production. South African mines are battling power outages, flooding, and maturing deposits with minimal new capital investment. Russian supply from Norilsk Nickel continues to be rerouted through sanctions, and the market suspects Norilsk has been drawing down strategic inventories to maintain export volumes, a strategy that cannot continue indefinitely.
Putting It Together
The analyst community is split. Bank of America has a $1,725 target, the LBMA consensus sits at $1,740, and Morgan Stanley is at $1,325. That is an unusually wide range for a single metal and it reflects genuine uncertainty about whether the surplus is real or whether it gets delayed by the hybrid boom and supply fragility.
From a technical perspective, the structure is bearish and there is no reason to fight it right now. Price is making lower highs and lower lows, the BOS confirmations are clean, and there is open space between current price at $1,386 and the next major demand zone at $1,150 to $1,200. For traders looking at palladium as a potential long, patience is the play. The $1,150 to $1,200 demand zone is where the risk to reward starts to make sense. A reaction from that level with RSI divergence or a CHoCH on a lower timeframe would be the first signal of a structural shift. Until then, bounces into the $1,550 to $1,600 supply zone are more likely to offer short opportunities than long entries.
The Weak High at $2,200 remains unmitigated. If the fundamental picture shifts, if the surplus fails to materialise and supply constraints deepen, that level is where the market has unfinished business. But that is a story for later in the year. Right now, the chart says lower and the fundamentals say the market is trying to find a new equilibrium. Palladium is one to keep on the watchlist, not one to rush into.
View our economic insights for the latest PGM supply and demand data and institutional positioning updates.
Risk Warning: Trading financial instruments, particularly those involving leverage, involves a substantial degree of risk and is not appropriate for all investors. The value of your investments can rise or fall sharply, and it is possible to lose the entirety of your invested capital. Do not trade with funds you cannot afford to lose. Nothing in this site should be read or construed as constituting advice on the part of Taurex or any of its affiliates, directors, officers or employees.