
Key Points
- Tuesday’s October CPI at 13:30 UTC is the week’s main event, forecast at 0.3 percent on the month after 0.6 percent in September, with core at 0.2 percent. With a December Fed hike priced at roughly 73 to 80 percent after strong payrolls, a hot print would hit both equities and gold, while a soft one could extend the relief bounce. PPI on Friday and a heavy run of Fed speakers add to the data load.
- The Nasdaq 100 is at about 27,050 after a 6 percent plunge on Thursday took it to a low near 26,450, and it remains below both moving averages, with supply at 28,380 to 28,590 the first major test if the bounce continues. Cisco, Applied Materials and CoreWeave results will show whether the AI selloff has run its course.
- Gold is at about 4,120 after bouncing from the 3,870 low on 30 October to a high near 4,147, and sits just under the 4,155 to 4,226 supply zone. The dollar, Treasury yields and CPI are driving it, and lower oil prices on US and Iran peace hopes have helped by easing inflation worries.
Last Week in Review
Thursday was the worst day for the S&P 500 since April 2025. It fell 4.36 percent to 7,353.73 and the Nasdaq Composite dropped 5.5 percent, as the Democratic midterm win raised the possibility of slower data-centre construction and chip stocks collapsed, with Micron down 17.5 percent, AMD 17.3 percent and Nvidia 9.3 percent. Qualcomm’s weak phone chip sales added to the damage, and the VIX jumped to about 28. AMD then bounced about 11 percent on Friday, and the S&P 500 finished the week at 7,376.86, down 2.7 percent, with the Nasdaq Composite down 3.4 percent.
October payrolls on Friday beat by a wide margin, with 165,000 jobs added against a forecast of roughly 60,000 to 65,000, unemployment down to 4.1 percent and wages up 0.4 percent on the month. The 10-year yield ended the week near 4.86 percent, the Dollar Index near 102.3 and December Fed hike odds rose to roughly 73 to 80 percent depending on the source. Gold fell more than 1 percent intraday to about 4,033 after the report before closing near 4,070.
The Bank of England raised Bank Rate to 4.00 percent on Thursday, its first hike in three years, and Governor Bailey said the next moves hinge on the Iran war and its effect on oil and inflation, citing encouraging news in the past 48 hours. Sterling fell about 0.9 percent on Friday to near 1.3356. Oil dropped about 13 percent on the week, with WTI near 90.34 on hopes the Iran conflict could ease after the US election, its biggest weekly fall since 2022.
Nasdaq 100: Bouncing Below Its Averages After the AI Rout
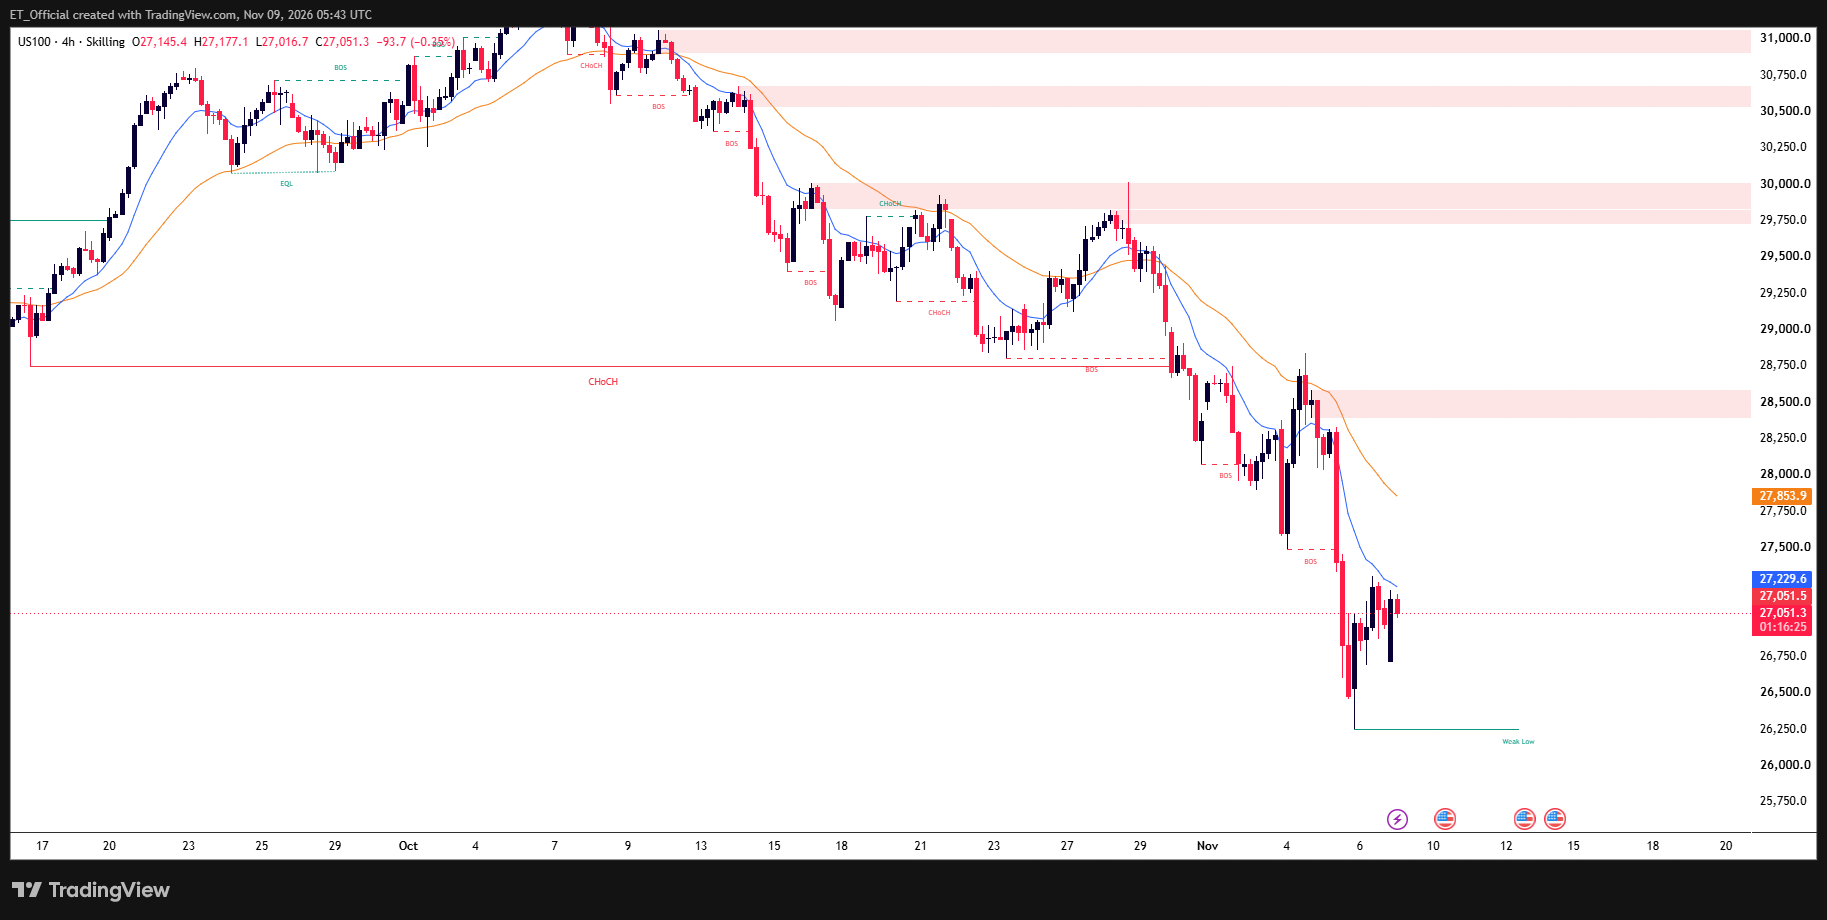
Chart: Nasdaq 100 (US100), 4H timeframe (TradingView, SMC)
Nasdaq 100 (US100) 4H chart, mid-September to 9 November 2026: price fell from highs near 31,000 in early October through lower highs at 30,000, 29,800 and 28,830 to a low near 26,450 on 5 November, and is trading at 27,051 below both moving averages near 27,230 and 27,850.
The 4H chart shows the Nasdaq 100 in a clear reversal after the early October peak near 31,000. A bearish change of character below 28,800 in September’s structure turned into a run of lower highs, from 30,000 to 29,800 on 28 October and 28,830 on 4 November, before Thursday’s heavy drop to a low near 26,450. Supply zones sit at 30,900 to 31,050, 30,530 to 30,670, 29,720 to 30,000 and 28,380 to 28,590.
Price has bounced to about 27,180 and is trading at 27,051, still beneath the faster average near 27,230 and the slower average near 27,850. Those averages are the first hurdles, and a rebound that cannot reclaim them would look like a pause inside the downtrend rather than a recovery, especially with the index down about 14 percent from its October high on Thursday’s close.
Above, 27,230, 27,850 and then the 28,380 to 28,590 supply zone are the levels to watch, and a move through 28,800 would be needed to reverse the damage to structure. Below, the 26,450 low is the line, and CPI on Tuesday and Cisco and Applied Materials on Thursday are the likely catalysts. Levels are read from the chart, so confirm them on your own screen.
Gold: Pressing Into Supply After the Midterm Bounce
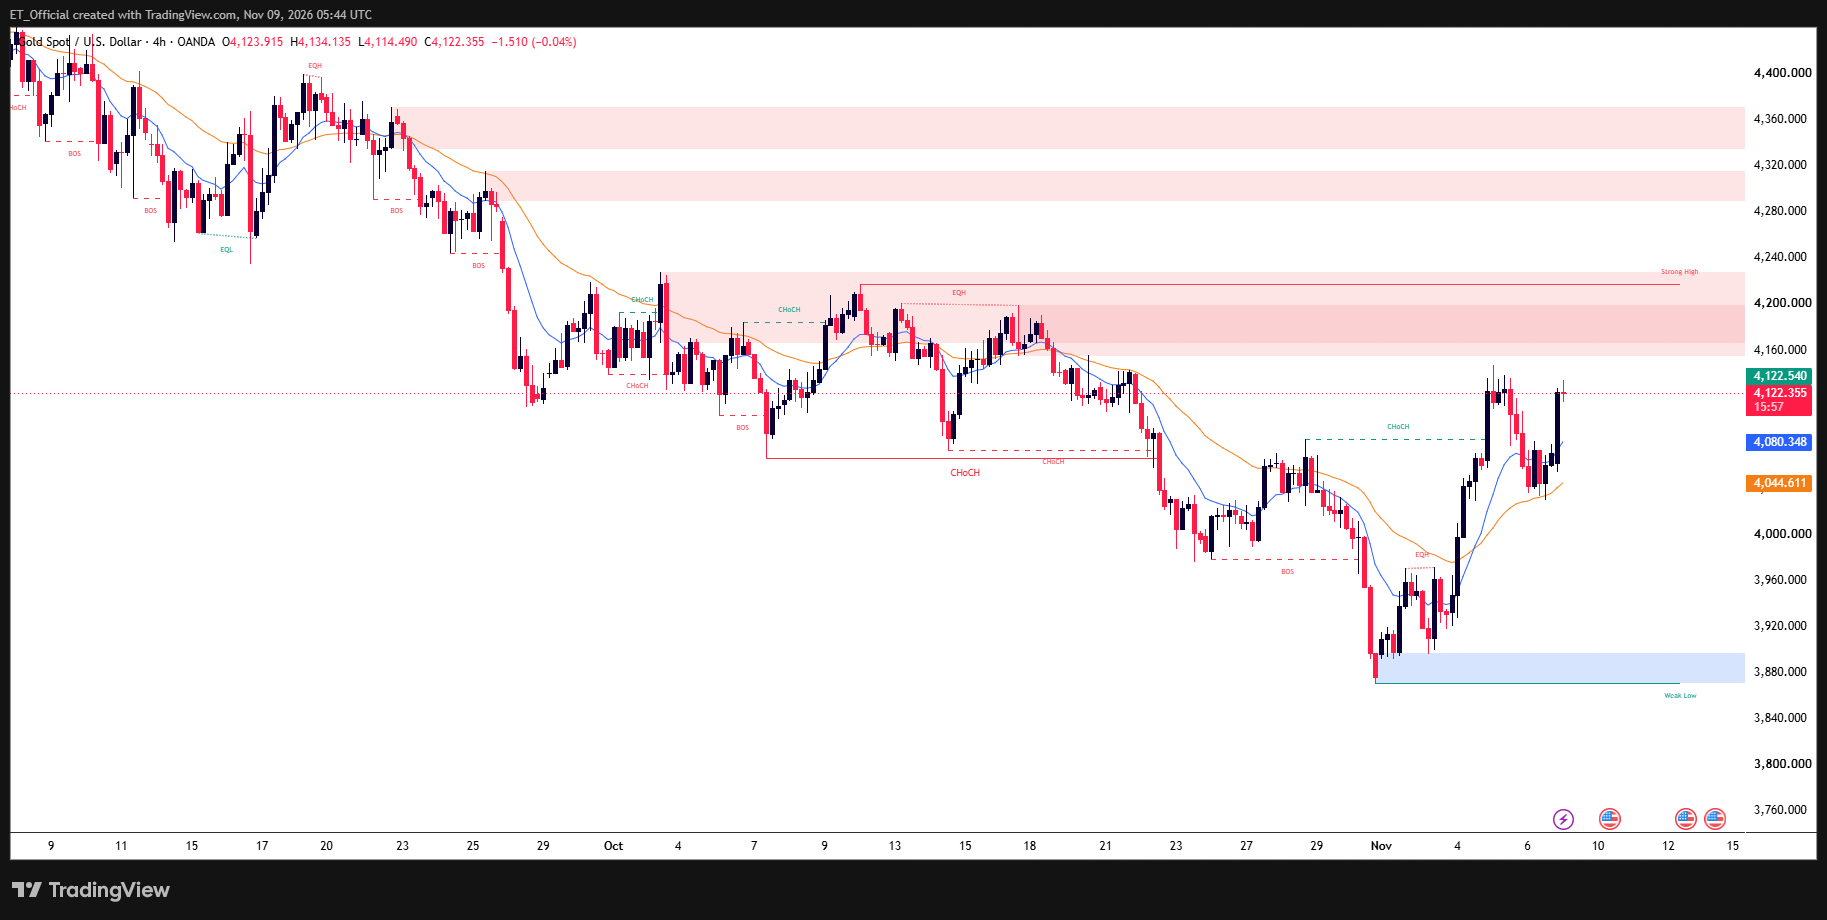
Chart: Gold (XAU/USD), 4H timeframe (TradingView, SMC)
Gold (XAU/USD) 4H chart, late October to 9 November 2026: price bounced from a low near 3,870 on 30 October to a high near 4,143 on 5 November, pulled back to about 4,035 on 6 November, and is trading at 4,122 beneath the 4,155 to 4,226 supply zone and above the 4,085 change of character level.
The 4H chart shows gold bouncing from a low near 3,870 on 30 October, where the 3,870 to 3,895 demand zone held, to a high near 4,143 on 5 November, with a bullish change of character near 4,085 on the way up. Price pulled back to about 4,035 on Friday after payrolls and has since pushed to 4,134 on Monday, trading at 4,122 above the faster average near 4,080 and the slower average near 4,045.
Sources tie the rally to a weaker dollar and lower yields after the midterms, with Democrats taking Congress raising hopes of gridlock and less borrowing, and to falling oil on US and Iran peace hopes. Friday’s strong jobs report reversed some of it, lifting the dollar and yields and December hike odds, which shows how sensitive gold remains to rate expectations.
Above, the 4,155 to 4,226 supply zone is the first real test, with a close through 4,226 opening 4,290 to 4,315. Below, the 4,085 change of character level and the 4,030 to 4,040 area from Friday matter first, with 3,870 to 3,895 the floor. A hot CPI could push the dollar and yields up and send gold back toward 4,085 and lower, while a soft print could give it the push through supply. Levels are chart-read approximations.
Key Events This Week
Monday 9 November Fed Speakers and Take-Two
Fed Governor Bowman speaks at 13:40 UTC and Richmond Fed President Barkin also appears, followed by a 3-year Treasury auction. Take-Two reports after the US close ahead of the 19 November launch of GTA VI, with KKR, Rocket Lab and The Trade Desk also reporting.
Tuesday 10 November US October CPI
October CPI lands at 13:30 UTC, forecast at 0.3 percent on the month after 0.6 percent in September, with core at 0.2 percent after 0.3 percent, and September’s annual rate was 3.7 percent. Waller, Logan and Schmid speak, the 10-year auction is at 18:00 UTC and CoreWeave reports after the close.
Wednesday 11 November Veterans Day
US stock markets open as normal but the bond market is closed for Veterans Day, so Treasury trading is thin and moves in the dollar and gold can be thinner. The COP31 climate summit in Antalya is expected to hold its leaders’ segment on 11 and 12 November.
Thursday 12 November UK GDP and AI Earnings
UK third quarter GDP lands at 07:00 UTC, followed by US jobless claims at 13:30 UTC, forecast near 194,000, and speeches from Hammack, Goolsbee, Daly and Williams. Cisco and Applied Materials report after the close, with Applied Materials guiding to about 10.25 billion dollars of revenue.
Friday 13 November US PPI and Euro Area GDP
Euro area third quarter GDP flash lands at 10:00 UTC, followed by US October PPI at 13:30 UTC, forecast at 0.4 percent after 1.3 percent, with core at 0.3 percent after 0.7 percent. Collins, Bowman and Daly speak, ahead of Nvidia and Disney results on 17 November.
Risk Warning: Trading financial instruments, particularly those involving leverage, involves a substantial degree of risk and is not appropriate for all investors. The value of your investments can rise or fall sharply, and it is possible to lose the entirety of your invested capital. Do not trade with funds you cannot afford to lose. Nothing in this site should be read or construed as constituting advice on the part of Taurex or any of its affiliates, directors, officers or employees.