
Key Points
- Gold is trapped beneath a descending trendline and the $4,740 to $4,760 supply zone. A rejection from trendline resistance near $4,620 to $4,640 could send price back toward the $4,400 to $4,440 demand zone.
- The S&P 500 has pulled back sharply from the 7,525 highs with RSI flashing bullish divergence. A sweep of the 7,325 to 7,350 demand zone could set up a bounce toward the 7,430 to 7,460 supply zone.
- GBP/JPY has rallied aggressively off the 211.30 to 211.50 demand zone with a bullish RSI crossover. If price holds above 212.80 on a pullback, the 213.50 to 214.00 supply zone becomes the next target.
Important: These are educational trade ideas based on technical and fundamental analysis. They are not financial advice or trade recommendations. Always conduct your own analysis and manage your risk before entering any position.
Trade Idea 1: Gold Trendline Trap
XAU/USD | H1 | Bearish
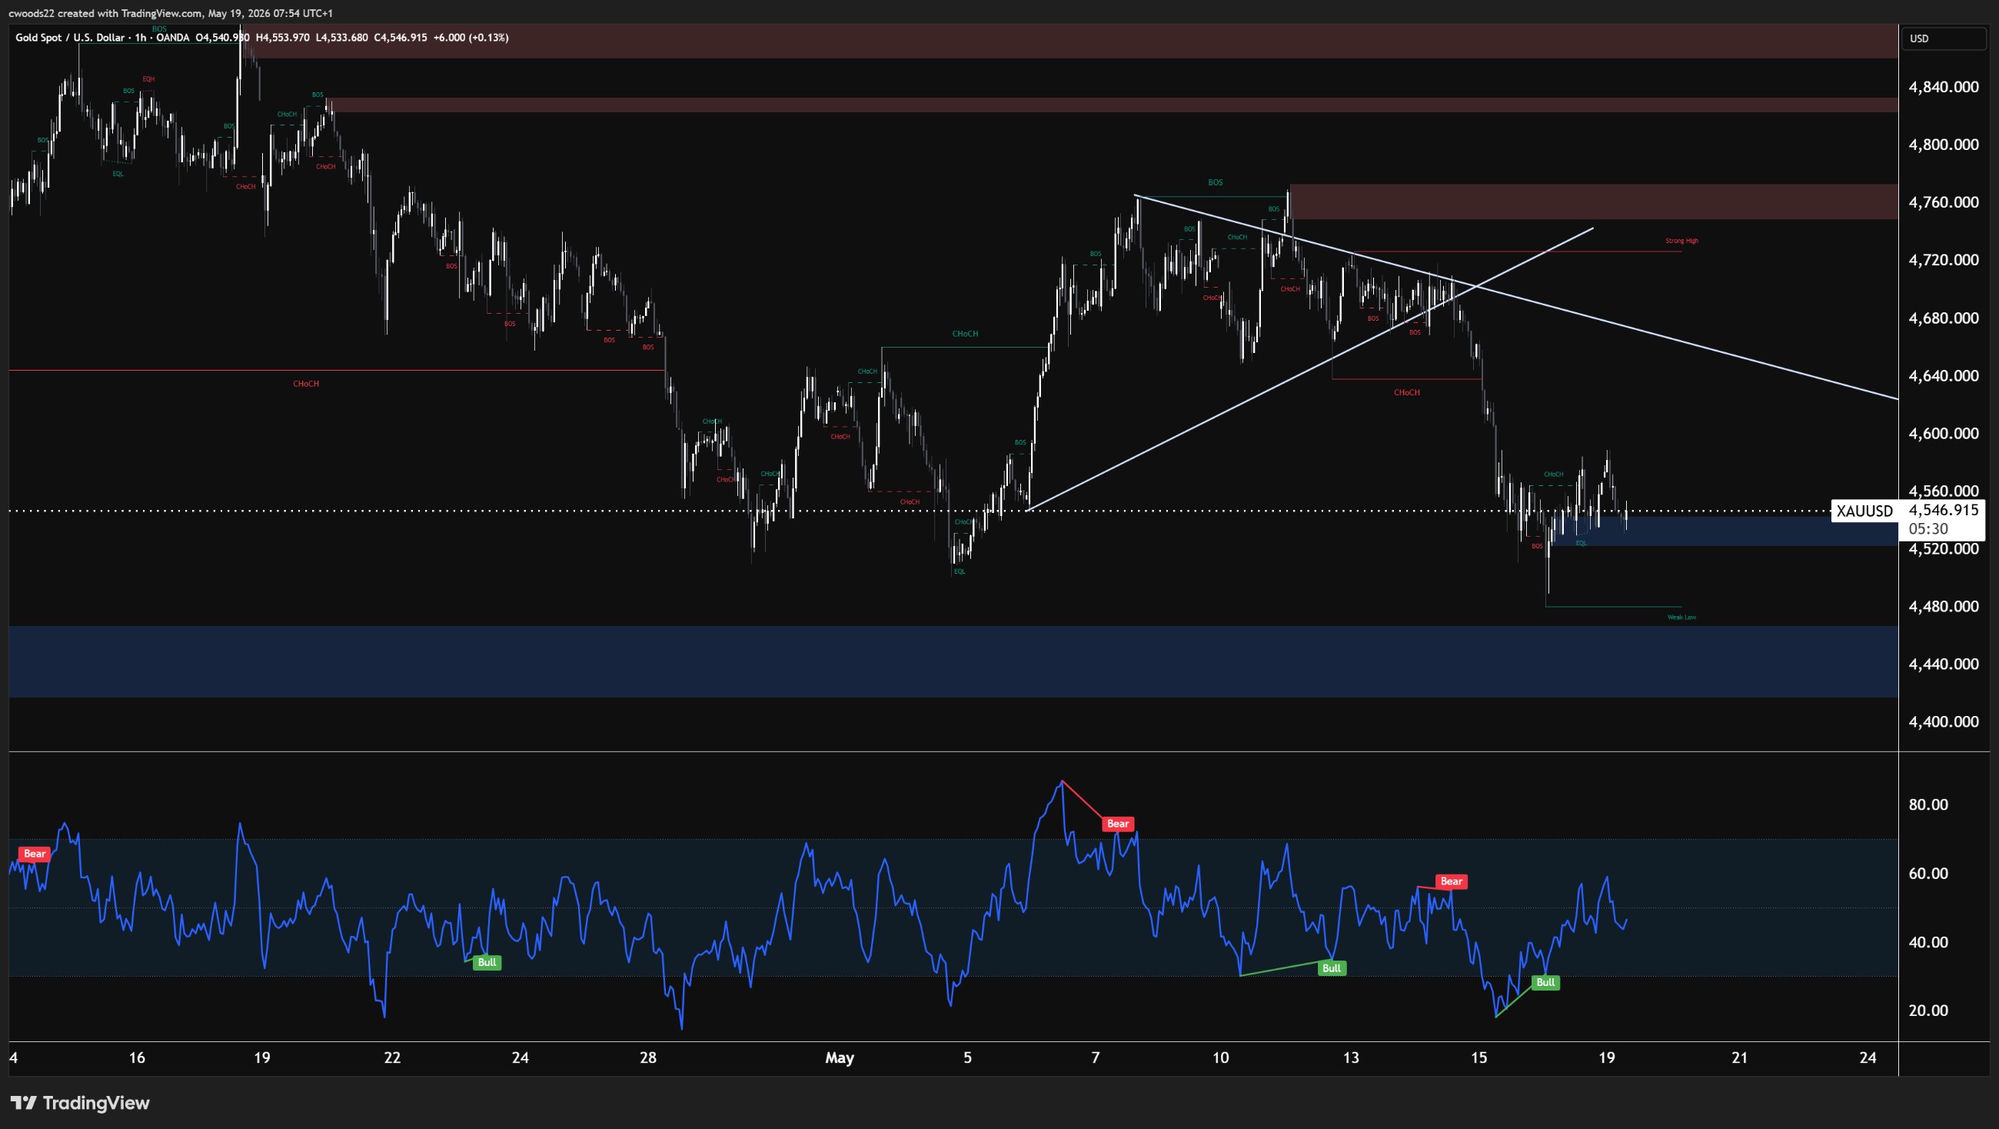
Gold is sitting at $4,547 after falling 4% last week, and the H1 chart tells a clear story. Price has been making consistent lower highs since the May 7 peak near $4,760, forming a descending trendline that has rejected every rally attempt. That trendline is now converging with the $4,620 to $4,640 supply zone, creating a ceiling that buyers have failed to break through.
The structure is bearish. There are multiple Change of Character (CHoCH) and Break of Structure (BOS) labels on the chart confirming the downtrend. The most recent CHoCH around $4,640 marked the shift from bullish to bearish on the shorter timeframe. RSI did flash a bullish divergence signal near the lows around May 16, which sparked a small bounce, but the signal has since faded and RSI is rolling over again from the 55 to 60 zone with a fresh bearish crossover.
The setup: watch for a rally into the descending trendline (currently intersecting around $4,620 to $4,640). If price reaches this level and prints a rejection candle (a strong bearish engulfing or a long upper wick), that could offer a short entry. The invalidation sits above the $4,760 supply zone, which is labelled as the “Strong High” on the chart. The first target is $4,480, with an extended target at the $4,400 to $4,440 demand zone (the large blue zone at the bottom of the chart).
The fundamental picture supports this setup. The 30 year yield is above 5%, the dollar is strengthening, and rate cut expectations have been pushed into 2027. Wednesday’s FOMC minutes are the catalyst. If rate hike discussions were on the table at Powell’s final meeting, that would add selling pressure. A dovish surprise would invalidate the short thesis.
Trade Idea 2: S&P 500 Demand Zone Bounce
US500 | H1 | Bullish
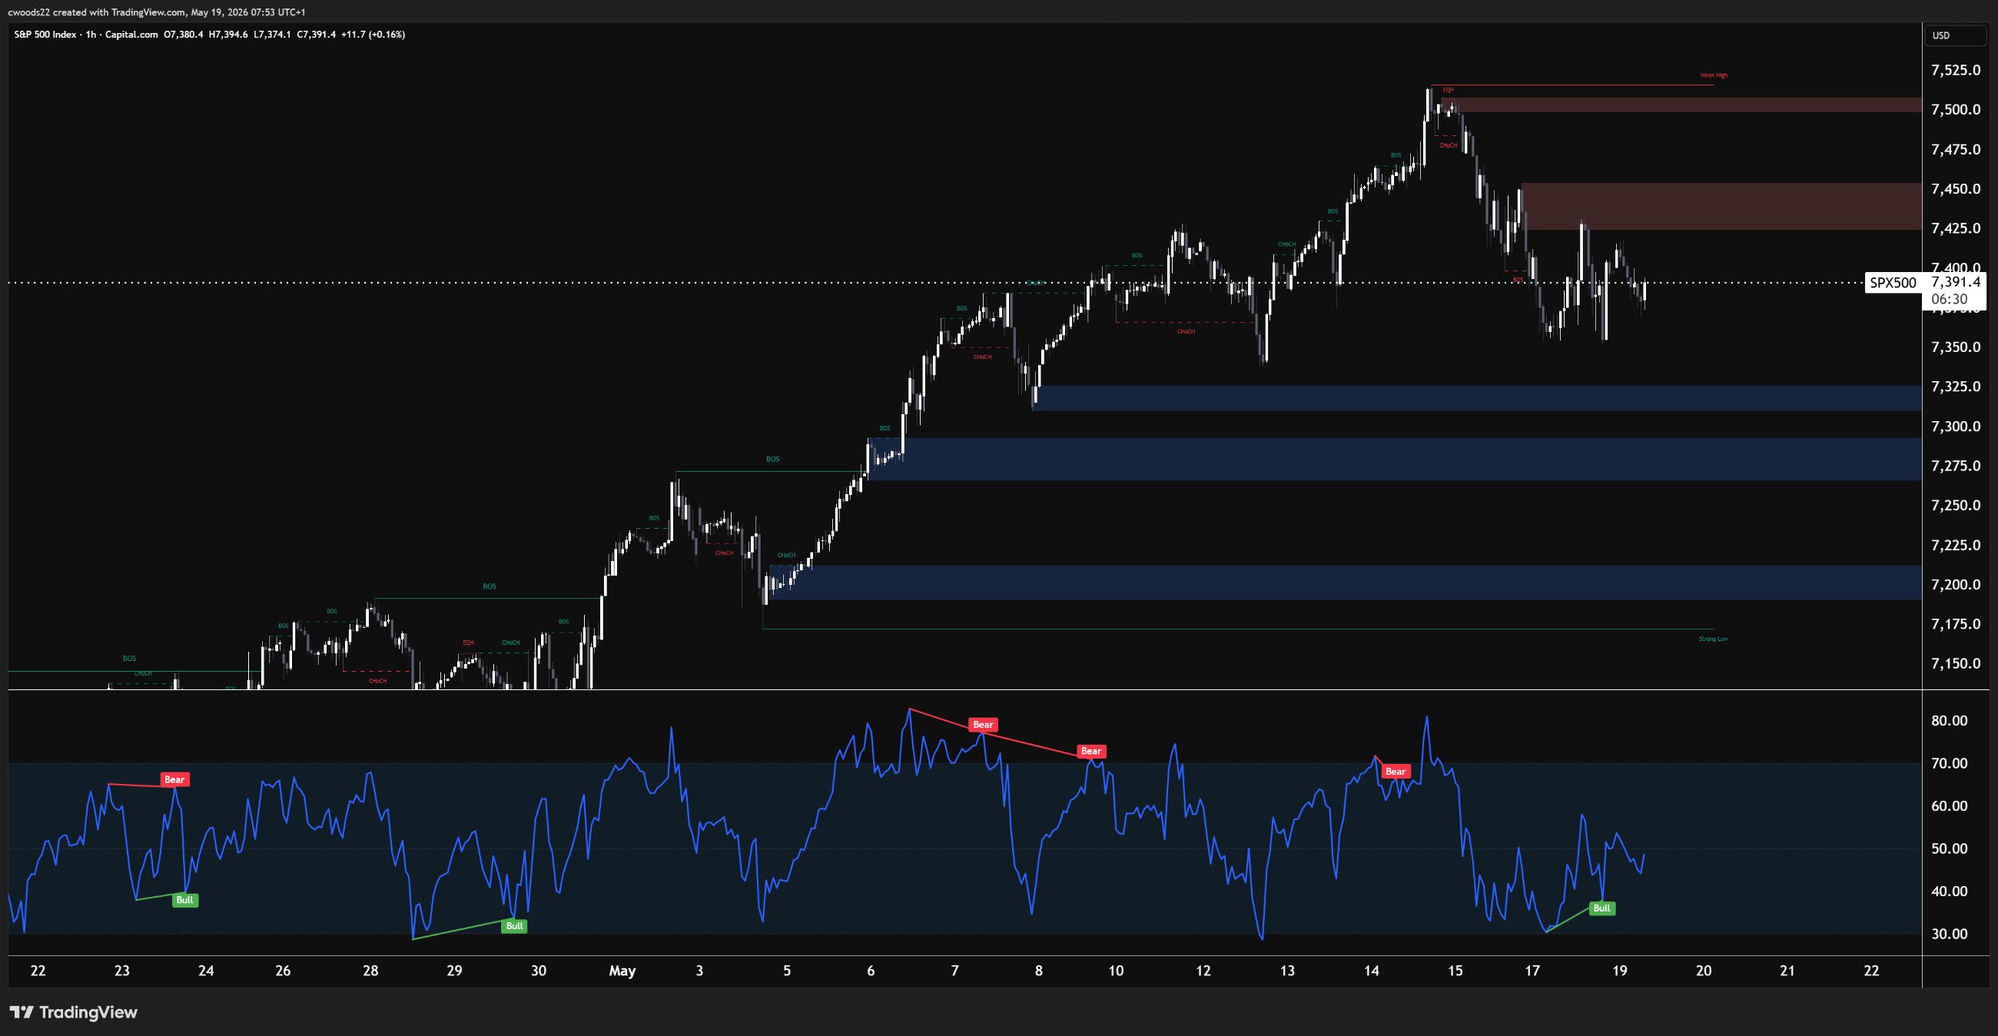
The S&P 500 at 7,391 has pulled back from the 7,525 “Strong High” and is now sitting in a zone of interest. What stands out on the H1 chart is the RSI picture: there is clear bullish divergence forming at the bottom of the indicator, with the RSI printing higher lows while price made lower lows. This kind of divergence often precedes a reversal or at least a meaningful bounce.
The demand zone between 7,325 and 7,350 is the key level to watch. This zone has been tested and held during the recent pullback, and it lines up with a previous BOS (Break of Structure) level from the rally on May 5 to 6. Below that, there is a deeper demand zone at 7,270 to 7,300 which represents a stronger structural support. The supply zone above sits at 7,430 to 7,460, where sellers stepped in repeatedly during the consolidation phase around May 13 to 14.
The setup: if the S&P 500 pulls back into the 7,325 to 7,350 demand zone and holds (look for a bullish reaction candle with the RSI still showing divergence), that could offer a long entry. The invalidation is a close below 7,270, which would break the deeper demand zone and shift the structure bearish. The target is the 7,430 to 7,460 supply zone, with an extended target at 7,490 to 7,500 if momentum carries.
The index held virtually flat last week despite a CPI print that came in half a percentage point above forecast. That kind of resilience typically signals underlying strength. Thursday’s flash PMIs (US manufacturing expected at 53.8, services at 51.3) are the confirmation event. Readings above 50 would reinforce the bullish case.
Trade Idea 3: GBP/JPY Momentum Ride
GBP/JPY | H1 | Bullish
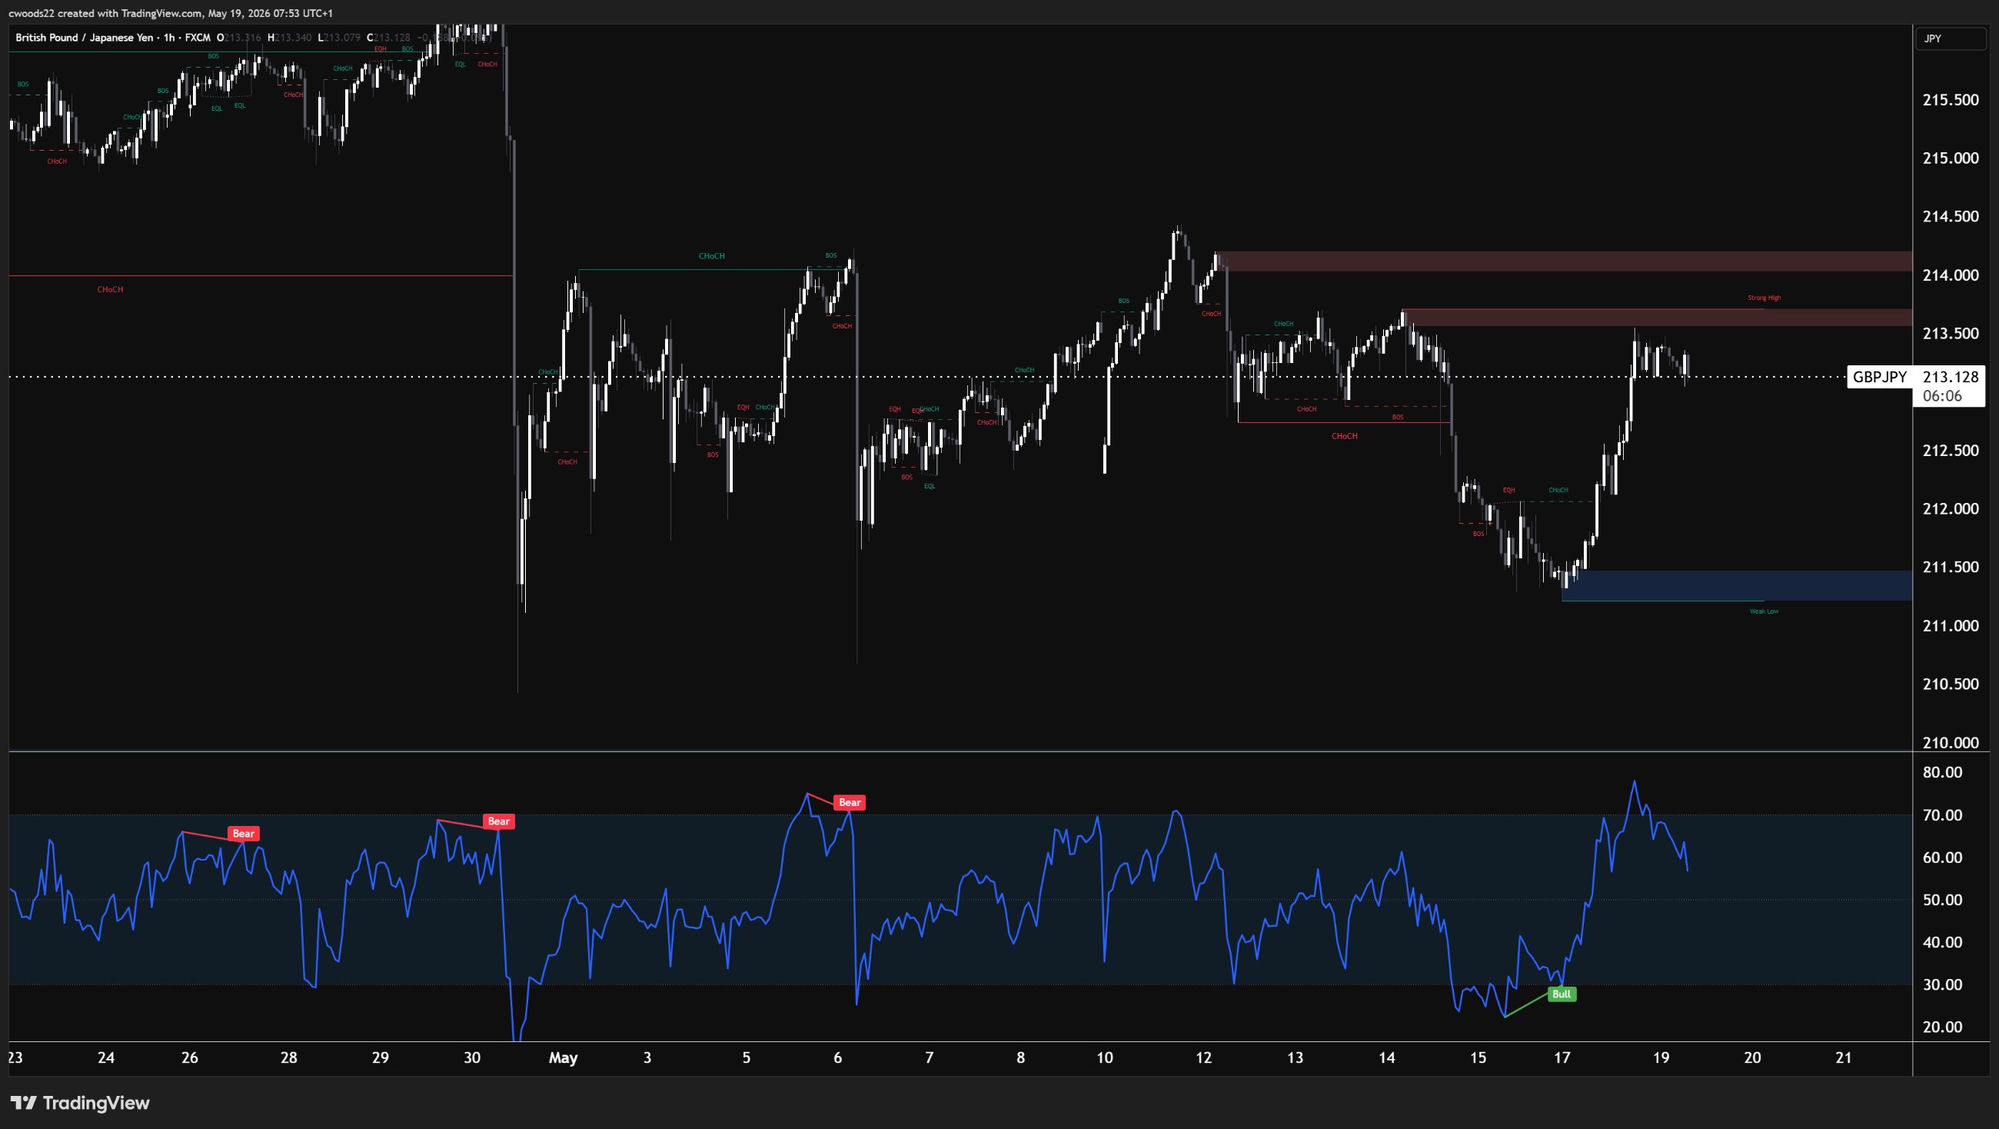
GBP/JPY at 213.13 has put in one of the cleanest demand zone reactions on the board. The pair sold off aggressively from the 215.50 highs into the 211.30 to 211.50 demand zone (the blue zone on the chart), where buyers stepped in decisively. The rally off that low has been impulsive, with multiple BOS confirmations on the way up, and RSI recovered from deeply oversold territory (below 30) with a confirmed bullish crossover.
The structure tells a story of momentum shifting. There is a CHoCH (Change of Character) visible around the 212.00 level, which marked the first higher low after the selloff. Price has since pushed through 213.00 and is approaching the supply zone between 213.50 and 214.00 (the red/pink zone on the chart). This supply zone rejected price on May 12 to 13, so it remains a key hurdle.
The setup: on a pullback toward 212.50 to 212.80, if price holds and the RSI stays above 50 (confirming the bullish momentum shift), that could offer a long entry. The invalidation is a close below 211.30, which would take out the demand zone and the recent swing low. The first target is 213.50 to 214.00 at the supply zone, with an extended target at 214.50 if the zone breaks.
The fundamental divergence between the Bank of England and the Bank of Japan supports this trade. UK inflation is still above 3% and the BoE is holding rates elevated, while the BoJ remains one of the most dovish central banks globally. Wednesday’s UK CPI (forecast 3.0%, previous 3.3%) is the catalyst. A hot reading above forecast would strengthen the bullish case for sterling against the yen.
Setup Summary
Gold Trendline Trap (Short): Entry $4,620–$4,640 | Invalidation above $4,760 | Target $4,480 (extended $4,400–$4,440)
S&P Demand Zone Bounce (Long): Entry 7,325–7,350 | Invalidation below 7,270 | Target 7,430–7,460 (extended 7,490–7,500)
GBP/JPY Momentum Ride (Long): Entry 212.50–212.80 | Invalidation below 211.30 | Target 213.50–214.00 (extended 214.50)
Risk Warning: Trading financial instruments, particularly those involving leverage, involves a substantial degree of risk and is not appropriate for all investors. The value of your investments can rise or fall sharply, and it is possible to lose the entirety of your invested capital. Do not trade with funds you cannot afford to lose. Nothing in this site should be read or construed as constituting advice on the part of Taurex or any of its affiliates, directors, officers or employees.


