Key Points
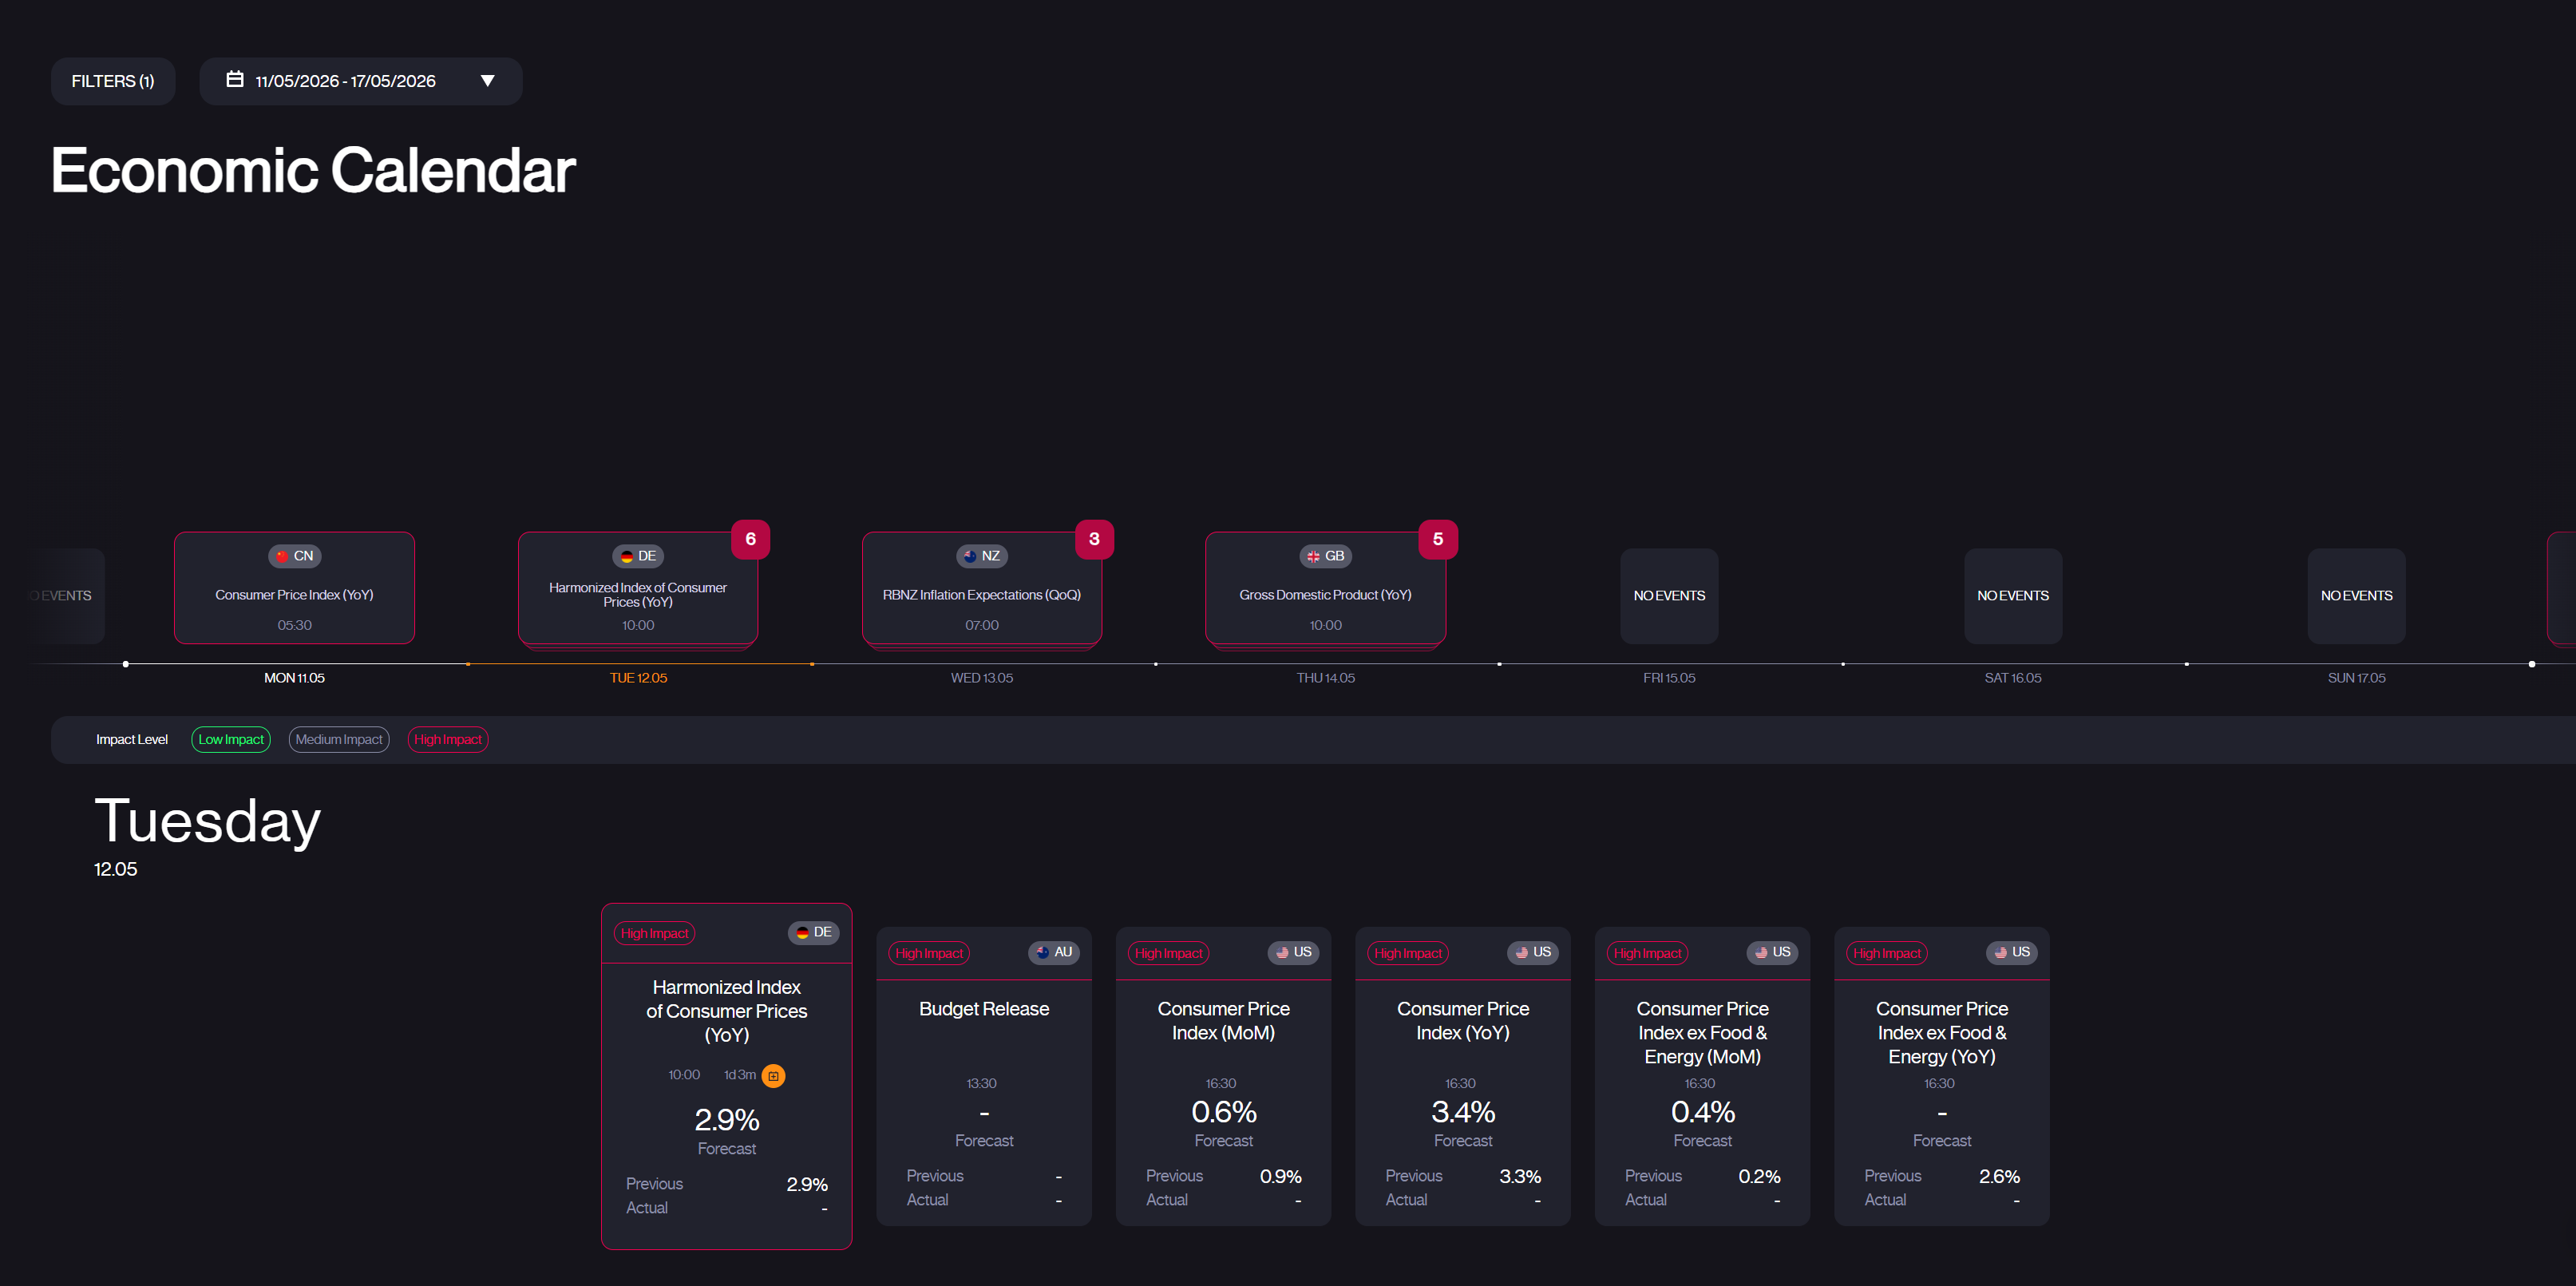
- Tuesday’s Consumer Price Index is the main event this week, with headline inflation forecast to rise to 3.4% year on year from 3.3%. Core CPI month on month is expected at 0.4%, double the March reading of 0.2%, which would signal that energy driven price pressures are starting to spread into the broader economy.
- Last Friday’s Non-Farm Payrolls blew past expectations at 115,000 jobs added versus a 62,000 forecast, marking the strongest two month stretch since 2024. The unemployment rate held at 4.3%, and the result pushed rate cut expectations further out as the labour market remains resilient.
- Jerome Powell’s tenure as Federal Reserve Chair officially ends on Friday, with Kevin Warsh set to take over. Gold has bounced to $4,715 after two weeks of losses, while WTI crude oil dropped 7% last week on ceasefire hopes before rebounding on renewed US and Iran tensions.
The Macro Picture
Last week was all about jobs. Friday’s Non-Farm Payrolls report came in at 115,000, nearly double the 62,000 consensus and marking the first back to back monthly gain since 2024. Healthcare added 37,000, transportation and warehousing added 30,000, and retail trade added 22,000. The unemployment rate held steady at 4.3%. The strong print reinforced the Fed’s position that there is no urgency to cut rates, with the probability of a June cut now sitting below 5%.
This week, the focus shifts to inflation. Tuesday’s CPI release will show whether the oil driven spike that has kept headline inflation elevated is starting to filter into core prices. Headline CPI is forecast at 3.4% year on year, up from 3.3% in March. The more important number is core CPI month on month, expected at 0.4%, which would be double the 0.2% reading in March. If core inflation accelerates, it removes any remaining argument for rate cuts this year.
Thursday marks the end of an era. Jerome Powell will step down as Federal Reserve Chair on May 15, with Kevin Warsh confirmed as his successor. Powell has led the Fed through the pandemic, the fastest rate hiking cycle in decades, and most recently the oil shock from the Strait of Hormuz closure. Warsh inherits an economy growing at 2.0% with inflation stuck above 3%, a strong labour market, and oil above $95 a barrel. How he communicates in his first weeks will set the tone for markets heading into the summer.
Gold: Bouncing from Two Week Lows

Chart: XAU/USD, H4 timeframe
Gold sits at $4,650, up around 2% from last week’s lows and trading at its highest level since April 22. The metal had fallen for two consecutive weeks under pressure from the hawkish Fed hold and rising Treasury yields, but buyers have stepped back in around the $4,550 to $4,600 area. On the H4 chart, the price has been consolidating around the $4,700 to $4,720 zone after the bounce, with resistance sitting near $4,800 to $4,850. The broader structure from the all time high near $5,595 is still corrective, but the immediate picture shows buyers defending the lows and pushing for a higher low.
The fundamental backdrop is mixed. On the bullish side, renewed clashes between the US and Iran have reignited geopolitical risk, the Strait of Hormuz remains closed, and central banks continued to accumulate gold reserves through Q1. On the bearish side, the strong Non-Farm Payrolls number has pushed the dollar higher and reduced rate cut expectations to near zero for June.
Tuesday’s CPI is the key catalyst. A hot reading (core above 0.4%) would strengthen the dollar further and likely push gold back toward the $4,550 to $4,600 support zone. A softer reading would weaken the dollar and could fuel the recovery toward $4,800 to $4,850 resistance. Gold often moves sharply on CPI data because inflation directly affects the rate outlook, and right now the market is priced for rates to stay higher for longer.
WTI Crude Oil: Geopolitics vs Ceasefire Hopes

Chart: WTI Crude Oil, H4 timeframe
WTI crude oil sits around $100 a barrel after posting a 7% weekly loss last week, the largest drop since February. Prices had been trading above $106 earlier in the week before ceasefire headlines between the US and Iran triggered a sharp selloff. However, the move was short lived. Renewed clashes over the weekend shattered those hopes and pushed prices back above $95 by Friday’s close. On the H4 chart, the structure shows a clear supply zone between $103 and $107 where sellers have been stepping in, and a demand zone between $88 and $92 where buyers defended during the April correction. The current price is consolidating between these two zones, with the $95 to $96 area acting as a short term pivot.
The oil market right now is driven almost entirely by the Strait of Hormuz. The International Energy Agency estimates the closure is removing around 14 million barrels per day from global supply, which is why prices remain elevated despite demand concerns. Any credible peace agreement would likely send WTI below $90 rapidly, while a further escalation could push it back above $106 and toward the March highs.
For traders watching this week, the CPI data on Tuesday matters because it shows how much of the oil price spike is feeding into consumer inflation. If CPI comes in hot, it strengthens the argument that elevated oil is becoming embedded in the economy, which could keep the Fed hawkish and the dollar strong. That combination has historically been a headwind for commodities priced in dollars, including oil itself.
What to Watch This Week
Tuesday is the biggest day on the calendar. US CPI lands at 12:30 UTC, with headline inflation forecast at 3.4% year on year and core CPI expected at 0.4% month on month. The ZEW Economic Sentiment Index for Europe also drops on Tuesday (forecast minus 20.5, previous minus 17.2), offering a read on how European investors feel about the outlook.
Wednesday brings US PPI data (month on month forecast 0.4%, previous 0.5%) and UK unemployment figures. PPI will be watched for signs that producer level price pressures are feeding through to the consumer level, which would add weight to a hot CPI reading. Thursday is packed. US Retail Sales (month on month forecast 0.6%, previous 1.7%) land alongside preliminary UK GDP (quarter on quarter forecast 0.6%, previous 0.1%) and Japanese GDP data. Thursday is also Jerome Powell’s final day as Federal Reserve Chair, marking the end of an eight year tenure.
Oil remains the wildcard throughout, with WTI around $98 and ceasefire talks hanging in the balance. Any headline from the Middle East could override everything on the economic calendar.
Editor note: Screenshot the Acuity calendar for May 11–15 2026. Key events: US CPI + ZEW Sentiment (Tue 12th), US PPI + UK Unemployment (Wed 13th), UK GDP + US Retail Sales + Powell’s last day as Fed Chair (Thu 14th).


