Key Points
- The traditional inverse correlation between crude oil and USD/CAD has broken down repeatedly since the Hormuz crisis began, with both assets moving in the same direction for extended periods on the H4 chart.
- Leveraged money is net short 64,215 CAD contracts (12th percentile of the past year), while 61% of retail traders are short USD/CAD, creating a classic contrarian setup that favours further CAD weakness.
- The supply shock nature of this oil rally means Canada is not capturing the same economic benefit it would from demand driven strength, and the risk premium flowing into the dollar is cancelling out CAD’s petro currency tailwind.
The Chart That Tells the Story
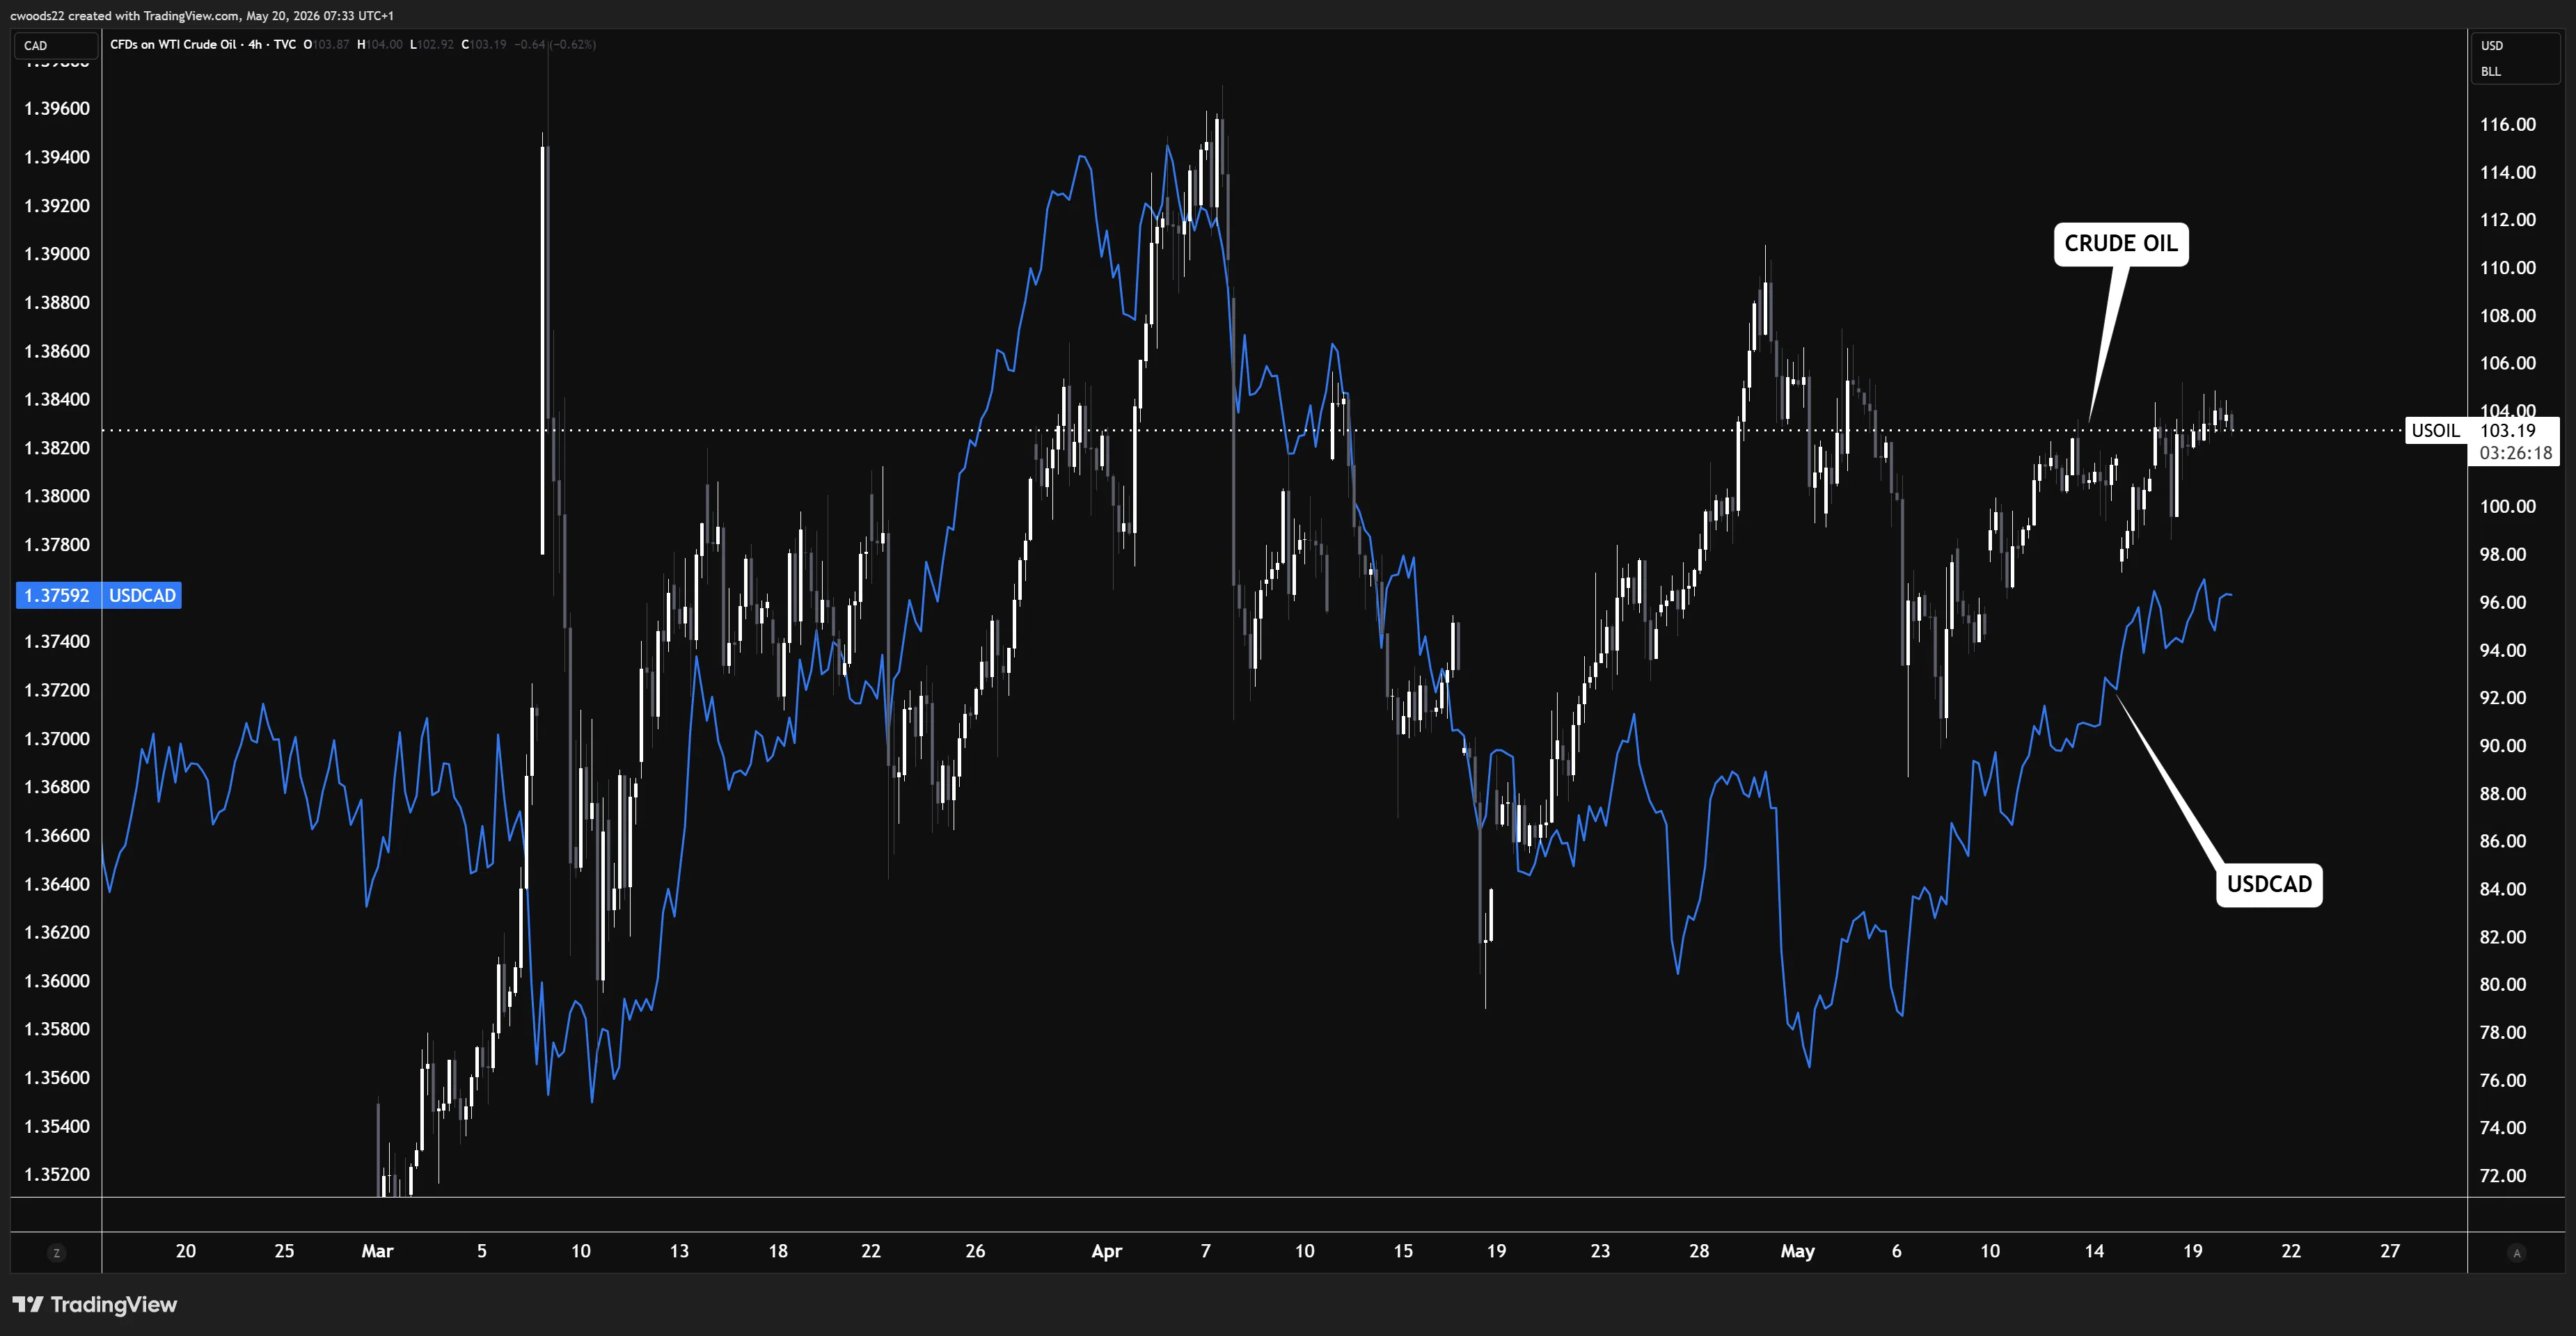
Chart: WTI Crude Oil (candlesticks) vs USD/CAD (blue line), H4 timeframe (TradingView)
A Correlation That Keeps Breaking
Pull up the H4 chart with WTI crude oil as candlesticks and USD/CAD as a line overlay, and the first thing that jumps out is how often these two have moved in the same direction since February. That should not happen. Canada is the fourth largest oil producer in the world, and oil exports still account for roughly 10% of GDP. When crude rallies, the loonie should rally with it, pulling USD/CAD lower. But it hasn’t been doing that.
In early March, oil surged from the mid $80s toward $100 as the Strait of Hormuz crisis escalated. The textbook response would have been a sharp drop in USD/CAD. Instead, the pair spiked to 1.3960. Both assets moved higher together. Then in April, when oil crashed from $116 all the way down to $80 on ceasefire hopes, USD/CAD also fell into the 1.3600s. Again, both moving in the same direction. And now in May, oil has bounced back to $103 and USD/CAD has climbed back to 1.3758. The pattern keeps repeating.
Why the Textbook Is Wrong Right Now
The answer comes down to the nature of the oil rally. This is a supply shock, not a demand story. When oil rises because global growth is strong and demand is pulling crude higher, Canada benefits directly: higher production revenues, stronger trade balance, capital inflows into Alberta. The loonie strengthens and the correlation works. But the Hormuz crisis is different. Oil is elevated because 10 million barrels per day of Gulf production is shut in. That does not generate additional revenue for Canadian producers, it simply raises the global price of crude while adding enormous uncertainty to the macro outlook.
That uncertainty is the key. When geopolitical risk spikes, capital flows into the US dollar as a safe haven regardless of oil. The dollar bid from risk aversion is overpowering the petro currency tailwind that the loonie would normally enjoy. Add to that a widening rate differential: the Fed is holding above 5% with rate cuts pushed into 2027, while the Bank of Canada has been stuck at 2.25% for four consecutive meetings. That 300+ basis point gap is a structural headwind for CAD that no oil rally can overcome.
The Positioning Picture
This is where it gets interesting for VIP. The latest Commitment of Traders data shows leveraged money net short 64,215 CAD contracts, sitting at the 12th percentile of the trailing 52 week range with a z-score of negative 1.19. Institutions are heavily positioned for continued Canadian dollar weakness. Meanwhile, retail sentiment data from Myfxbook shows 61% of retail traders are short USD/CAD, betting on CAD strength, presumably because they see oil at $103 and assume the old correlation will reassert itself.
That is a textbook contrarian divergence. Institutional money is betting against the loonie while retail is betting on it. In my experience, when the smart money and the crowd disagree this sharply, the smart money tends to be right. The retail crowd is anchored to a correlation that is not working, and the institutional positioning suggests USD/CAD has room to push higher even while oil stays elevated.
What to Watch
On the H4 chart, USD/CAD is trading at 1.3758 and has been grinding higher since the mid May low around 1.3688. The 1.3800 level is the near term resistance to watch. A clean break and hold above 1.3800 would confirm the bullish structure and open the door toward a retest of the 1.3960 March high. On the downside, a drop below 1.3688 would suggest the correlation is finally reasserting and CAD bulls have control.
For oil, the $108 level is the immediate ceiling where sellers have stepped in repeatedly on the H4. A break above $108 on fresh Hormuz escalation would likely see USD/CAD rally in tandem (correlation still broken), while a drop back below $95 on a ceasefire deal would be the catalyst for the correlation to snap back to its traditional form, with CAD strengthening and USD/CAD falling.
The key event this week is Wednesday’s FOMC minutes. Any hint that the Fed discussed rate hikes at their last meeting would widen the rate differential further and add fuel to a USD/CAD push higher. On the Canadian side, the BoC does not meet until June 10, so for now the policy gap stays wide. The June 10 meeting could be the moment the correlation question gets answered: if the BoC signals further cuts while oil remains elevated, the decoupling becomes structural. If they hold and inflation picks up, CAD may finally start responding to oil again.
View our economic insights for the latest cross-asset correlation data and institutional positioning updates.
Risk Warning: Trading financial instruments, particularly those involving leverage, involves a substantial degree of risk and is not appropriate for all investors. The value of your investments can rise or fall sharply, and it is possible to lose the entirety of your invested capital. Do not trade with funds you cannot afford to lose. Nothing in this site should be read or construed as constituting advice on the part of Taurex or any of its affiliates, directors, officers or employees.