Key Points
- The 10 year Treasury yield pushing toward 5.6%, its highest level since 2007, remains the dominant force across today’s board, pressuring gold and weighing on the tech heavy Nasdaq, even as this morning’s RBA hike gets absorbed quickly by AUD/USD.
- AUD/USD is trading at 0.7022, recovering off this morning’s low near 0.7000 after the RBA delivered a hawkish 25bp hike to 4.60%, with the 0.7005 to 0.7010 zone the level that has held through the move so far.
- Gold is trading at 4,131, capped below the 4,152 to 4,160 zone as elevated yields raise the opportunity cost of holding a non yielding asset, keeping that zone the one to watch for the next directional cue.
- US100 is trading at 30,139, extending a multi day slide and testing the 30,080 low, with the 30,240 to 30,280 zone the broken support that is now being watched as potential resistance.
AUD/USD: Digesting the RBA Decision
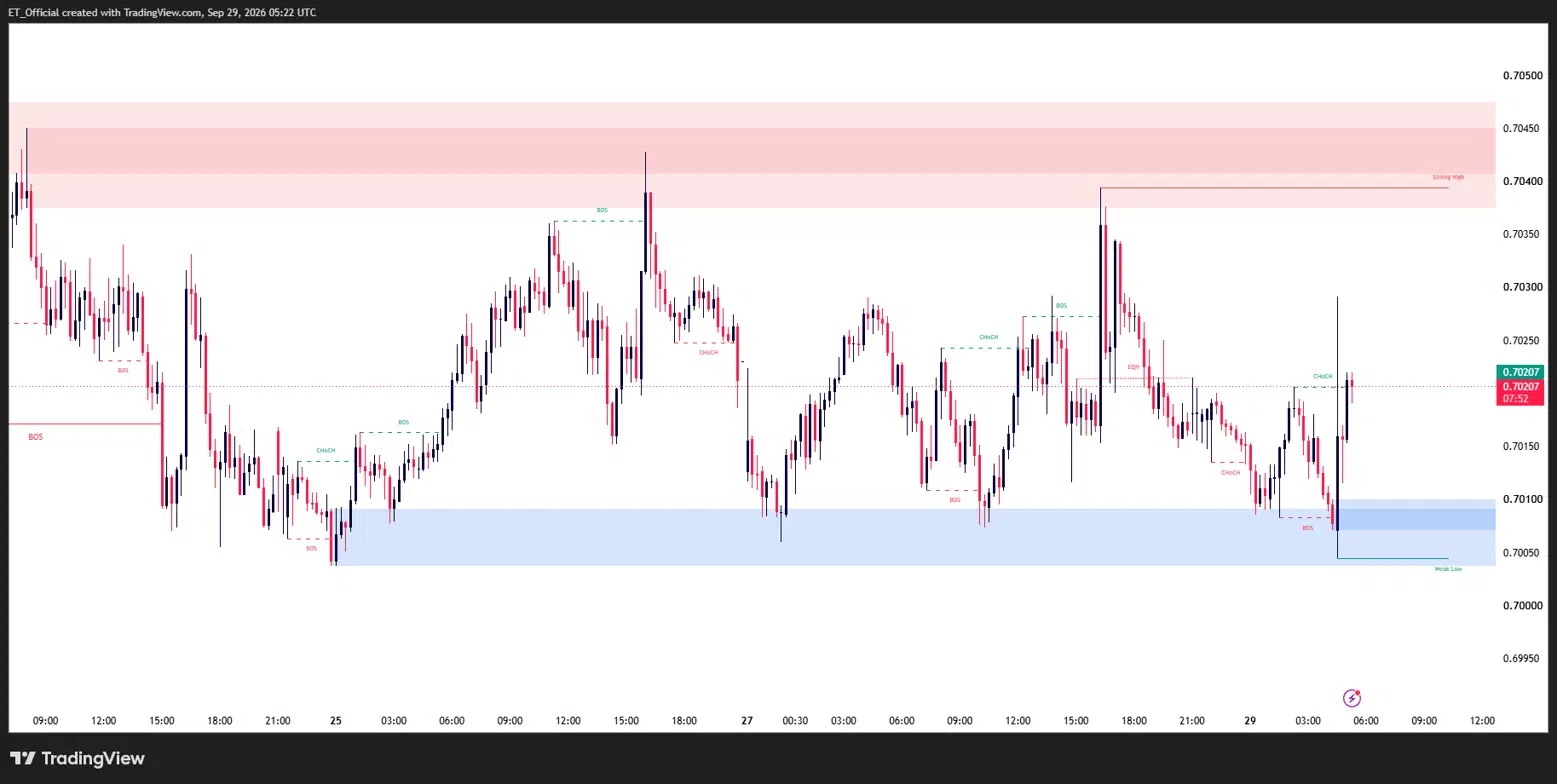
Chart: AUD/USD, H1 timeframe (TradingView, SMC)
The H1 chart shows AUD/USD reversing off this morning’s low near 0.7000 immediately after the RBA’s decision, reclaiming the CHoCH near 0.7021 and confirming a short term shift back to the upside. Price is now consolidating just above that level at 0.7022, working toward the 0.7040 to 0.7045 zone above.
The 0.7005 to 0.7010 zone is the demand area that held through this morning’s low and is worth watching for how price behaves on any retest. A hold there would keep the recovery structure intact toward the 0.7040 zone and the broader range high near 0.7050 beyond it; a clean break back below it would undermine that structure.
The RBA’s unanimous 25bp hike to 4.60%, the highest cash rate since November 2011, alongside explicit guidance that further tightening remains on the table, is the fundamental backdrop behind today’s move. Tomorrow’s Australian household spending and inflation data are the next test for that narrative, and traders should treat all levels here as areas to monitor rather than as instructions to act.
Gold: Pressured by Rising Yields
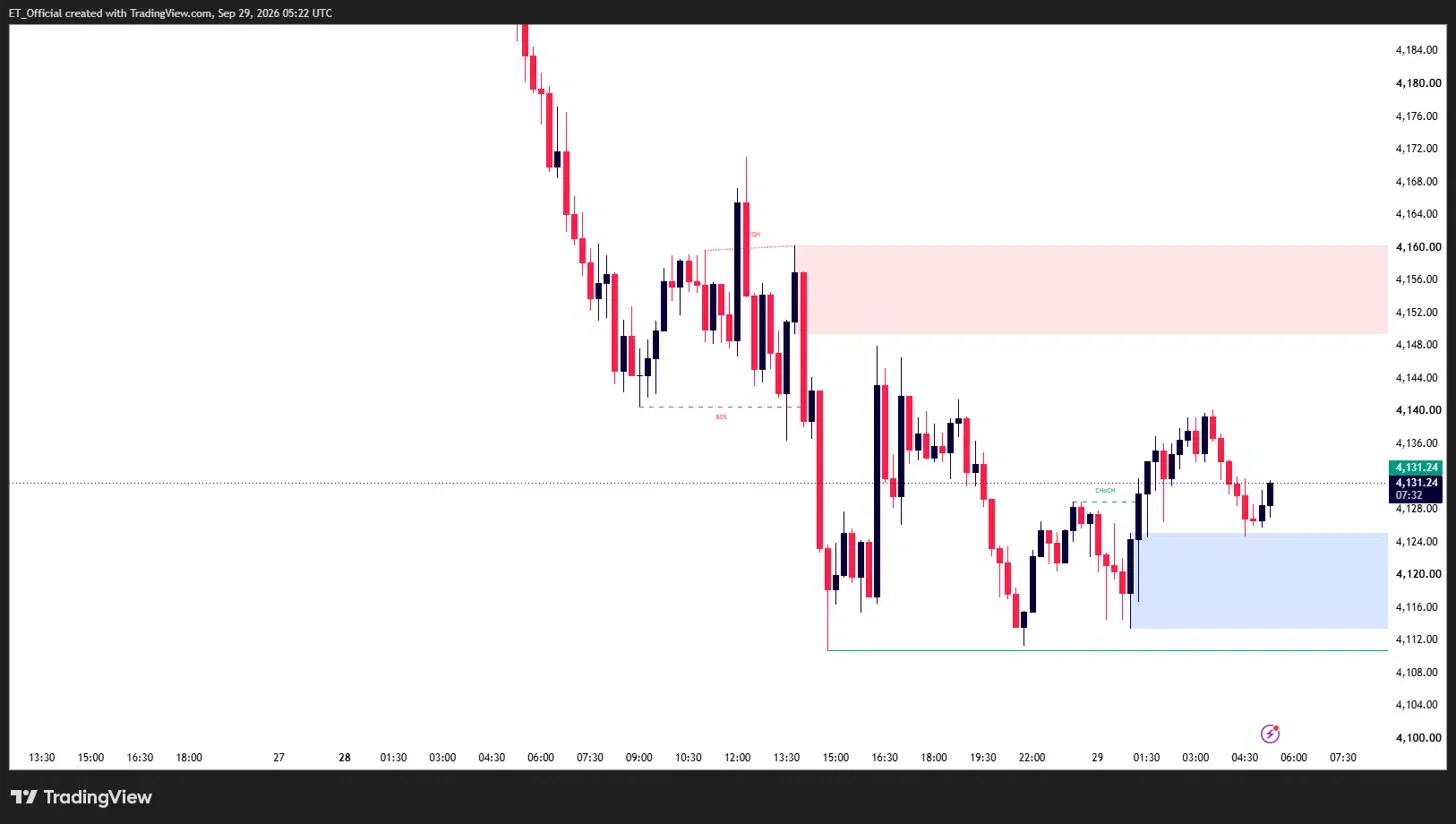
Chart: XAU/USD, H1 timeframe (TradingView, SMC)
Gold’s H1 chart shows a sharp break of structure lower from the highs above 4,160, extending the decline to a low near 4,112 before a recovery attempt lifted price back to 4,131. That recovery has been rejected on each approach to the 4,152 to 4,160 zone above.
The 4,145 to 4,160 zone, the broken support now being retested as supply, is the level to watch for how price reacts on the next approach. Continued rejection there would keep the broader structure pointed toward the 4,112 zone and the 4,090 to 4,050 area beyond it; a clean reclaim would call the near term bearish structure into question.
The 10 year Treasury yield pushing toward 5.6%, its highest level since 2007, continues to raise the opportunity cost of holding a non yielding asset, and with the yield trend showing no signs of reversing ahead of Wednesday’s Core PCE and Friday’s payrolls, that backdrop remains the key driver to monitor.
US100: Extending the Slide
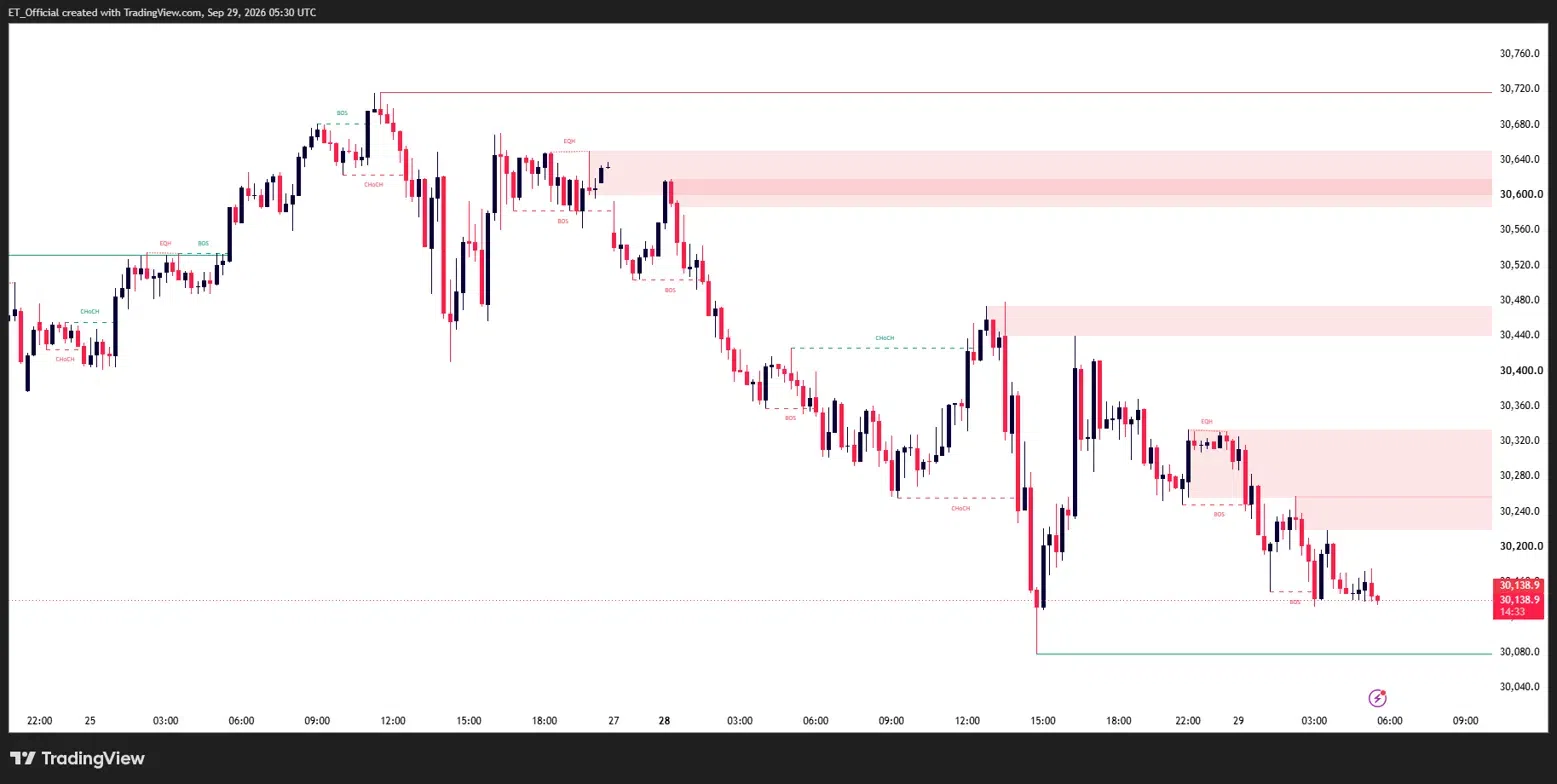
Chart: US100 (Nasdaq 100), H1 timeframe (TradingView, SMC)
US100’s H1 chart shows a heavy multi day decline, with price rejected repeatedly from a sequence of supply zones on the way down, most recently the 30,280 to 30,320 zone, before extending to a fresh session low near 30,139, just above the prior low at 30,080.
The 30,240 to 30,280 zone, the most recent area of rejection, is worth watching on any retracement. Continued rejection there would keep the broader structure pointed toward the 30,080 low and, on a clean break, the 30,000 psychological level beyond it; a reclaim of that zone would be the first sign the slide is losing momentum.
Rising Treasury yields near 5.6% continue to weigh most heavily on the tech heavy Nasdaq complex, and with US ADP, Core PCE, ISM Manufacturing, and Friday’s payrolls all still ahead this week, that yield backdrop remains the key factor to track.
Key Events This Week
Wednesday 30 September: US ADP Employment Change (12:15 UTC) and Core PCE Price Index (12:30 UTC)
Thursday 1 October: US ISM Manufacturing PMI (14:00 UTC)
Friday 2 October: US Non-Farm Payrolls and Unemployment Rate (12:30 UTC), the week’s main event
Risk Warning: Trading financial instruments, particularly those involving leverage, involves a substantial degree of risk and is not appropriate for all investors. The value of your investments can rise or fall sharply, and it is possible to lose the entirety of your invested capital. Leveraged products, in particular, amplify both potential gains and losses. Before engaging in such trading, you must assess your financial goals, experience level, and appetite for risk. It is your sole responsibility to ensure that you understand the mechanics and risks of trading, including margin requirements, and to seek independent financial advice where appropriate. Do not trade with funds you cannot afford to lose. Nothing in this article constitutes financial advice or a personal recommendation, and nothing in this site should be read or construed as constituting advice on the part of Taurex or any of its affiliates, directors, officers or employees. All levels referenced are for educational and illustrative purposes only.