Key Points
- Gold has slumped to $4,180 from a high near $4,410 just four sessions ago, even as the US 10 year Treasury yield pushes to 5.234%, its highest level since 2007. For most of the past week the two were climbing together in defiance of the textbook inverse relationship; that correlation has now reasserted itself hard.
- The break lower in gold began almost exactly as the 10 year cleared 5.20% for the first time this cycle, and the timing lines up too cleanly to be coincidence. The implication for VIP members: this looks less like a correlation breakdown and more like a delayed reaction that has finally caught up.
The Textbook Relationship, Revisited
Regular readers of this series will remember the edition from mid August, when gold and the 30 year yield were rising together and I made the case that the traditional inverse relationship had broken down under the weight of fiscal deficit concerns and persistent central bank buying. That breakdown has not disappeared, but the chart below shows a new wrinkle worth walking through: even when gold and yields decouple from the textbook for a while, the relationship does not stay broken forever.
The basic mechanism has not changed. Gold pays no interest, no dividend, no coupon, so when Treasury yields rise, the opportunity cost of holding it rises too, and capital tends to prefer the guaranteed return on offer in government debt. That is the framework. What this week’s chart shows is a case where gold ignored that framework for the better part of a week, then abruptly snapped back into line with it.
The Overlay
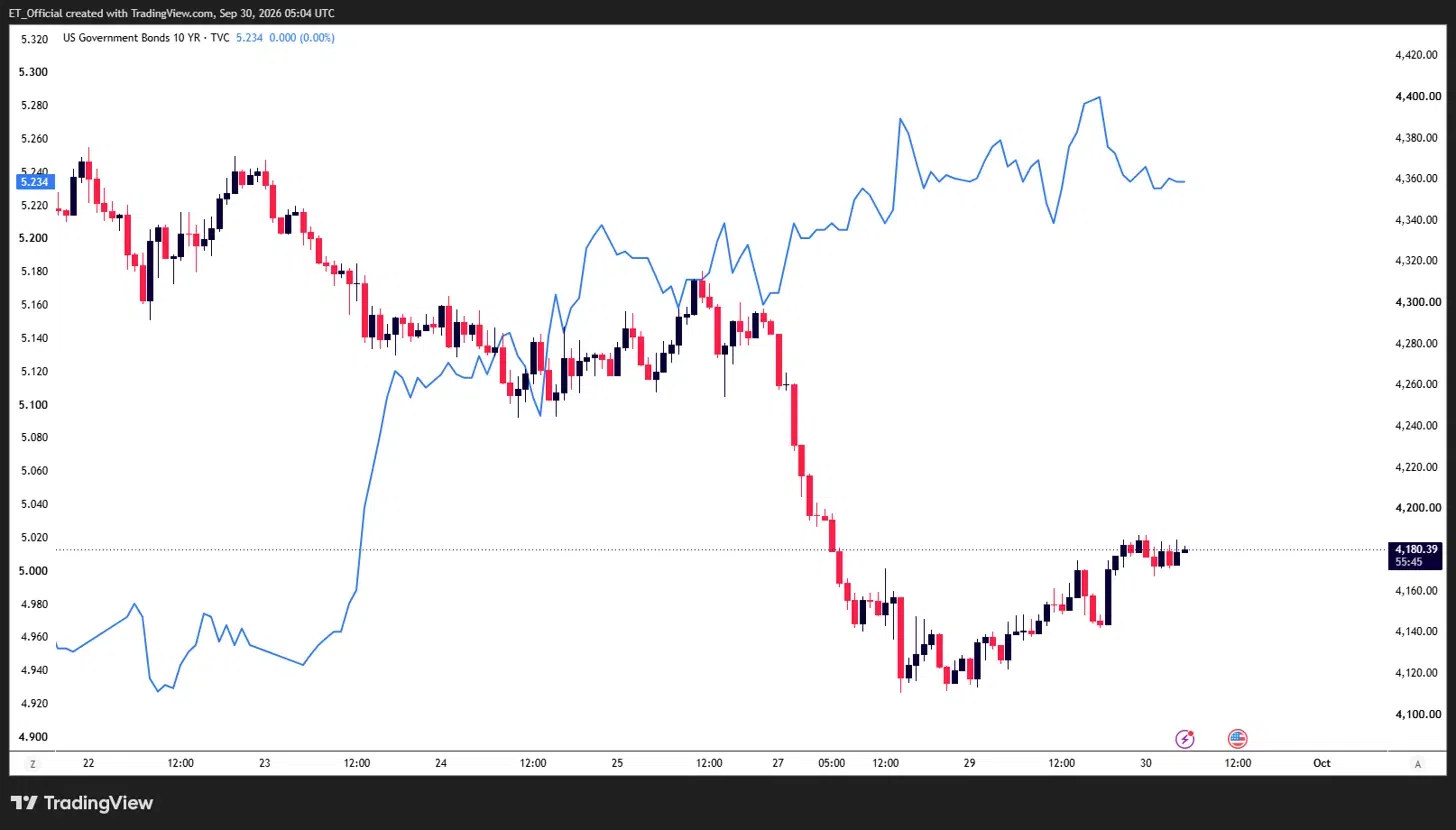
Chart: XAU/USD (candlesticks) vs US 10Y Treasury Yield (blue line), Daily timeframe (TradingView)
Together for a Week, Then a Sharp Divergence
Look at the left side of this chart, from the 22nd through the 26th of September. The 10 year yield climbed from around 4.94% to above 5.20%, and gold, rather than selling off in response, pushed higher alongside it, topping out near $4,410 on the 26th. That is precisely the kind of decoupling covered in the August edition of this series, geopolitical risk premium and fiscal concerns overpowering the yield signal.
What happened next is the more interesting part. As the yield continued grinding higher through the 27th, 28th and 29th, eventually touching a fresh high above 5.27% before settling at its current 5.234%, gold did not just stall, it broke sharply. Price fell from that $4,410 high to a low near $4,120 in the space of three sessions, before stabilising into today’s session at $4,180. The correlation that had gone quiet for a week reasserted itself all at once, and violently.
The read here is not that the fiscal and geopolitical drivers behind gold’s earlier strength have disappeared. It is that there appears to be a threshold, somewhere north of 5.20% on the 10 year, beyond which the opportunity cost argument starts to dominate again regardless of what else is going on. Once yields pushed convincingly through that level this week, gold’s structural buyers were no longer enough to hold the line against the pure carry argument.
What This Means for Your Trading
The practical takeaway is that the inverse relationship between gold and yields is not dead, it is conditional. Structural drivers such as central bank buying and geopolitical risk premium can override it for a stretch, but this week is a reminder that a sustained, decisive move higher in yields can still overwhelm those drivers once it goes far enough. Traders who treated this month’s decoupling as a permanent regime change were caught offside when the correlation snapped back.
Going forward, the 10 year yield’s path relative to the 5.20% to 5.27% band is the level to watch. A continued push higher from here, particularly if it is driven by fiscal or auction related concerns rather than growth optimism, would likely keep gold under pressure even if the underlying structural bull case remains intact. A pullback in yields back below 5.20%, on the other hand, would be the first sign this week’s break lower in gold was an overreaction rather than the start of a deeper repricing.
Risk Warning: Trading financial instruments, particularly those involving leverage, involves a substantial degree of risk and is not appropriate for all investors. The value of your investments can rise or fall sharply, and it is possible to lose the entirety of your invested capital. Do not trade with funds you cannot afford to lose. Nothing in this site should be read or construed as constituting advice on the part of Taurex or any of its affiliates, directors, officers or employees.